Download
1 / 50
500 likes | 529 Vues
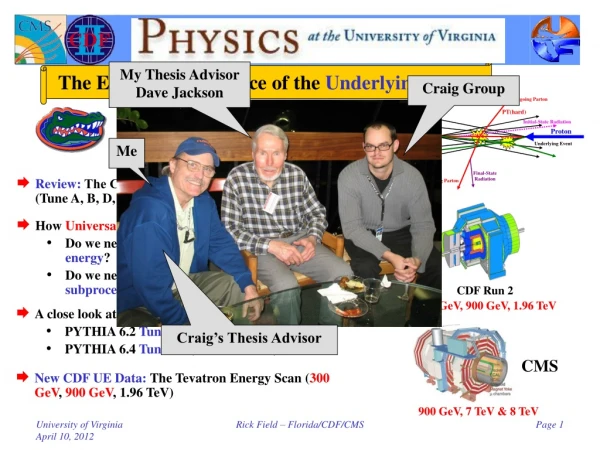
a. The Energy Dependence of the Underlying Event. My Thesis Advisor Dave Jackson. Craig Group. Rick Field University of Florida. Me. Outline. Review: The CDF Tevatron “underlying event” tunes (Tune A, B, D, AW, DW, D6, DWT, D6T). How Universal are the QCD MC Model Tunes?

E N D
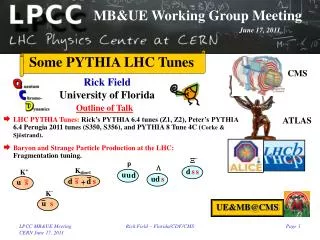
a The Energy Dependence of the Underlying Event My Thesis Advisor Dave Jackson Craig Group Rick Field University of Florida Me Outline • Review: The CDF Tevatron “underlying event” tunes (Tune A, B, D, AW, DW, D6, DWT, D6T). • How Universal are the QCD MC Model Tunes? • Do we need a separate tune for each center-of-mass energy? 900 GeV, 1.96 TeV, 7 TeV, etc. • Do we need a separate tune for each hard QCD subprocess? Jet Production, Drell-Yan Production, etc. CDF Run 2 300 GeV, 900 GeV, 1.96 TeV • A close look at two PYTHIA tunes: • PYTHIA 6.2 Tune DW (CDF UE tune). • PYTHIA 6.4 Tune Z1 (CMS UE tune). Craig’s Thesis Advisor CMS • New CDF UE Data: The Tevatron Energy Scan (300 GeV, 900 GeV, 1.96 TeV) 900 GeV, 7 TeV & 8 TeV Rick Field – Florida/CDF/CMS
“Hard Scattering” Component QCD Monte-Carlo Models:High Transverse Momentum Jets • Start with the perturbative 2-to-2 (or sometimes 2-to-3) parton-parton scattering and add initial and final-state gluon radiation (in the leading log approximation or modified leading log approximation). “Underlying Event” • The “underlying event” consists of the “beam-beam remnants” and from particles arising from soft or semi-soft multiple parton interactions (MPI). The “underlying event” is an unavoidable background to most collider observables and having good understand of it leads to more precise collider measurements! • Of course the outgoing colored partons fragment into hadron “jet” and inevitably “underlying event” observables receive contributions from initial and final-state radiation. Rick Field – Florida/CDF/CMS
“Hard Scattering” Component QCD Monte-Carlo Models:Lepton-Pair Production • Start with the perturbative Drell-Yan muon pair production and add initial-state gluon radiation (in the leading log approximation or modified leading log approximation). “Underlying Event” • The “underlying event” consists of the “beam-beam remnants” and from particles arising from soft or semi-soft multiple parton interactions (MPI). • Of course the outgoing colored partons fragment into hadron “jet” and inevitably “underlying event” observables receive contributions from initial-state radiation. Rick Field – Florida/CDF/CMS
Proton Proton Proton Proton MPI, Pile-Up, and Overlap MPI: Multiple Parton Interactions • MPI: Additional 2-to-2 parton-parton scatterings within a single hadron-hadron collision. Pile-Up Interaction Region Dz • Pile-Up: More than one hadron-hadron collision in the beam crossing. Overlap • Overlap: An experimental timing issue where a hadron-hadron collision from the next beam crossing gets included in the hadron-hadron collision from the current beam crossing because the next crossing happened before the event could be read out. Rick Field – Florida/CDF/CMS
Traditional Approach CDF Run 1 Analysis • Look at charged particle correlations in the azimuthal angle Df relative to a leading object (i.e. CaloJet#1, ChgJet#1, PTmax, Z-boson). For CDF PTmin = 0.5 GeV/c hcut = 1. Charged Particle Df Correlations PT > PTmin |h| < hcut Leading Calorimeter Jet or Leading Charged Particle Jet or Leading Charged Particle or Z-Boson “Transverse” region very sensitive to the “underlying event”! • Define |Df| < 60o as “Toward”, 60o < |Df| < 120o as “Transverse”, and |Df| > 120o as “Away”. • All three regions have the same area in h-f space, Dh×Df = 2hcut×120o = 2hcut×2p/3. Construct densities by dividing by the area in h-f space. Rick Field – Florida/CDF/CMS
PYTHIA 6.206 Defaults MPI constant probability scattering • Plot shows the “Transverse” charged particle density versus PT(chgjet#1) compared to the QCD hard scattering predictions of PYTHIA 6.206 (PT(hard) > 0) using the default parameters for multiple parton interactions and CTEQ3L, CTEQ4L, and CTEQ5L. PYTHIA default parameters Default parameters give very poor description of the “underlying event”! Note Change PARP(67) = 4.0 (< 6.138) PARP(67) = 1.0 (> 6.138) Rick Field – Florida/CDF/CMS
Tuning PYTHIA 6.2:Multiple Parton Interaction Parameters Hard Core Determines the energy dependence of the MPI! Determine by comparing with 630 GeV data! Affects the amount of initial-state radiation! Take E0 = 1.8 TeV Reference point at 1.8 TeV Rick Field – Florida/CDF/CMS
“Transverse” Charged DensitiesEnergy Dependence Increasing e produces less energy dependence for the UE resulting in less UE activity at the LHC! Lowering PT0 at 630 GeV (i.e. increasing e) increases UE activity resulting in less energy dependence. • Shows the “transverse” charged PTsum density (|h|<1, PT>0.4 GeV) versus PT(charged jet#1) at 630 GeV predicted by HERWIG 6.4 (PT(hard) > 3 GeV/c, CTEQ5L) and a tuned version of PYTHIA 6.206 (PT(hard) > 0, CTEQ5L, Set A, e = 0, e = 0.16 (default) and e = 0.25 (preferred)). • Also shown are the PTsum densities (0.16 GeV/c and 0.54 GeV/c) determined from the Tano, Kovacs, Huston, and Bhatti “transverse” cone analysis at 630 GeV. Rick Field Fermilab MC Workshop October 4, 2002! Reference point E0 = 1.8 TeV Rick Field – Florida/CDF/CMS
CDF Run 1 PT(Z) PYTHIA 6.2 CTEQ5L • Shows the Run 1 Z-boson pT distribution (<pT(Z)> ≈ 11.5 GeV/c) compared with PYTHIA Tune A (<pT(Z)> = 9.7 GeV/c), Tune A25 (<pT(Z)> = 10.1 GeV/c), and Tune A50 (<pT(Z)> = 11.2 GeV/c). UE Parameters ISR Parameter Vary the intrensic KT! Intrensic KT Rick Field – Florida/CDF/CMS
CDF Run 1 PT(Z) Tune used by the CDF-EWK group! PYTHIA 6.2 CTEQ5L • Shows the Run 1 Z-boson pT distribution (<pT(Z)> ≈ 11.5 GeV/c) compared with PYTHIA Tune A (<pT(Z)> = 9.7 GeV/c), and PYTHIA Tune AW (<pT(Z)> = 11.7 GeV/c). UE Parameters ISR Parameters Effective Q cut-off, below which space-like showers are not evolved. Intrensic KT The Q2 = kT2 in as for space-like showers is scaled by PARP(64)! Rick Field – Florida/CDF/CMS
Df Jet#1-Jet#2 Jet#1-Jet#2 Df Distribution Jet-Jet Correlations (DØ) • MidPoint Cone Algorithm (R = 0.7, fmerge = 0.5) • L= 150 pb-1 (Phys. Rev. Lett. 94 221801 (2005)) • Data/NLO agreement good. Data/HERWIG agreement good. • Data/PYTHIA agreement good provided PARP(67) = 1.0→4.0 (i.e. like Tune A, best fit 2.5). Rick Field – Florida/CDF/CMS
CDF Run 1 PT(Z) PYTHIA 6.2 CTEQ5L • Shows the Run 1 Z-boson pT distribution (<pT(Z)> ≈ 11.5 GeV/c) compared with PYTHIA Tune DW, and HERWIG. UE Parameters ISR Parameters Tune DW uses D0’s perfered value of PARP(67)! Intrensic KT Tune DW has a lower value of PARP(67) and slightly more MPI! Rick Field – Florida/CDF/CMS
PYTHIA 6.2 Tunes All use LO as with L = 192 MeV! UE Parameters Uses CTEQ6L Tune A energy dependence! ISR Parameter Intrinsic KT Rick Field – Florida/CDF/CMS
PYTHIA 6.2 Tunes All use LO as with L = 192 MeV! UE Parameters Tune B Tune AW Tune BW Tune A ATLAS energy dependence! ISR Parameter Tune DW Tune D6 Tune D Tune D6T Intrinsic KT Rick Field – Florida/CDF/CMS
“Transverse” Charged Density • Shows the charged particle density in the “transverse” region for charged particles (pT > 0.5 GeV/c, |h| < 1) at 7 TeVas defined by PTmax, PT(chgjet#1), and PT(muon-pair) from PYTHIATune DWat the particle level (i.e. generator level). Charged particle jets are constructed using the Anti-KT algorithm with d = 0.5. Rick Field – Florida/CDF/CMS
Min-Bias “Associated”Charged Particle Density • Shows the “associated” charged particle density in the “transverse” region as a function of PTmax for charged particles (pT > 0.5 GeV/c, |h| < 1, not including PTmax) for “min-bias” events at 0.2 TeV, 0.9 TeV, 1.96 TeV, 7 TeV, 10 TeV, 14 TeVpredicted by PYTHIA Tune DW at the particle level (i.e. generator level). LHC14 LHC10 LHC7 Tevatron 900 GeV RHIC 0.2 TeV → 1.96 TeV (UE increase ~2.7 times) 1.96 TeV → 14 TeV (UE increase ~1.9 times) RHIC LHC Tevatron Linear scale! Rick Field – Florida/CDF/CMS
Min-Bias “Associated”Charged Particle Density • Shows the “associated” charged particle density in the “transverse” region as a function of PTmax for charged particles (pT > 0.5 GeV/c, |h| < 1, not including PTmax) for “min-bias” events at 0.2 TeV, 0.9 TeV, 1.96 TeV, 7 TeV, 10 TeV, 14 TeVpredicted by PYTHIA Tune DW at the particle level (i.e. generator level). LHC14 LHC10 LHC7 Tevatron 900 GeV RHIC 7 TeV → 14 TeV (UE increase ~20%) LHC7 LHC14 Linear on a log plot! Log scale! Rick Field – Florida/CDF/CMS
Conclusions November 2009 • We are making good progress in understanding and modeling the “underlying event”. RHIC data at 200 GeV are very important! • The new Pythia pT ordered tunes (py64 S320 and py64 P329) are very similar to Tune A, Tune AW, and Tune DW. At present the new tunes do not fit the data better than Tune AW and Tune DW. However, the new tune are theoretically preferred! • It is clear now that the default value PARP(90) = 0.16 is not correct and the value should be closer to the Tune A value of 0.25. • The new and old PYTHIA tunes are beginning to converge and I believe we are finally in a position to make some legitimate predictions at the LHC! • All tunes with the default value PARP(90) = 0.16 are wrong and are overestimating the activity of min-bias and the underlying event at the LHC! This includes all my “T” tunes and the (old) ATLAS tunes! UE&MB@CMS • Need to measure “Min-Bias” and the “underlying event” at the LHC as soon as possible to see if there is new QCD physics to be learned! Rick Field – Florida/CDF/CMS
“Transverse” Charged Particle Density • Fake data (from MC) at 900 GeV on the “transverse” charged particle density, dN/dhdf, as defined by the leading charged particle (PTmax) and the leading charged particle jet (chgjet#1) for charged particles with pT > 0.5 GeV/c and |h| < 2. The fake data (from PYTHIA Tune DW) are generated at the particle level (i.e. generator level) assuming 0.5 M min-bias events at 900 GeV (361,595 events in the plot). Leading Charged Particle Jet, chgjet#1. Prediction! Leading Charged Particle, PTmax. Rick Field MB&UE@CMS Workshop CERN, November 6, 2009 Rick Field – Florida/CDF/CMS
“Transverse” Charge Density Rick Field MB&UE@CMS Workshop CERN, November 6, 2009 factor of 2! Prediction! 900 GeV → 7 TeV (UE increase ~ factor of 2) LHC 900 GeV LHC 7 TeV ~0.4 → ~0.8 • Shows the charged particle density in the “transverse” region for charged particles (pT > 0.5 GeV/c, |h| < 2) at 900 GeV and 7 TeVas defined by PTmax from PYTHIATune DW andat the particle level (i.e. generator level). Rick Field – Florida/CDF/CMS
“Transverse” Charged Particle Density • Fake data (from MC) at 900 GeV on the “transverse” charged particle density, dN/dhdf, as defined by the leading charged particle (PTmax) and the leading charged particle jet (chgjet#1) for charged particles with pT > 0.5 GeV/c and |h| < 2. The fake data (from PYTHIA Tune DW) are generated at the particle level (i.e. generator level) assuming 0.5 M min-bias events at 900 GeV (361,595 events in the plot). Monte-Carlo! Real Data! • CMS preliminary data at 900 GeV on the “transverse” charged particle density, dN/dhdf, as defined by the leading charged particle (PTmax) and the leading charged particle jet (chgjet#1) for charged particles with pT > 0.5 GeV/c and |h| < 2. The data are uncorrected and compared with PYTHIA Tune DW after detector simulation (216,215 events in the plot). Rick Field – Florida/CDF/CMS
“Transverse” Charged PTsum Density Monte-Carlo! Real Data! • Fake data (from MC) at 900 GeV on the “transverse” charged PTsum density, dPT/dhdf, as defined by the leading charged particle (PTmax) and the leading charged particle jet (chgjet#1) for charged particles with pT > 0.5 GeV/c and |h| < 2. The fake data (from PYTHIA Tune DW) are generated at the particle level (i.e. generator level) assuming 0.5 M min-bias events at 900 GeV (361,595 events in the plot). • CMS preliminary data at 900 GeV on the “transverse” charged PTsum density, dPT/dhdf, as defined by the leading charged particle (PTmax) and the leading charged particle jet (chgjet#1) for charged particles with pT > 0.5 GeV/c and |h| < 2. The data are uncorrected and compared with PYTHIA Tune DW after detector simulation (216,215 events in the plot). Rick Field – Florida/CDF/CMS
PYTHIA Tune DW Ratio CMS CMS • Ratio of CMS preliminary data at 900 GeV and 7 TeV on the “transverse” charged particle density, dN/dhdf, as defined by the leading charged particle jet (chgjet#1) for charged particles with pT > 0.5 GeV/c and |h| < 2. The data are uncorrected and compared with PYTHIA Tune DW after detector simulation. • CMS preliminary data at 900 GeV and 7 TeV on the “transverse” charged particle density, dN/dhdf, as defined by the leading charged particle jet (chgjet#1) for charged particles with pT > 0.5 GeV/c and |h| < 2. The data are uncorrected and compared with PYTHIA Tune DW after detector simulation. Rick Field – Florida/CDF/CMS
PYTHIA Tune DW CMS ATLAS • ATLAS preliminary data at 900 GeV and 7 TeV on the “transverse” charged particle density, dN/dhdf, as defined by the leading charged particle (PTmax) for charged particles with pT > 0.5 GeV/c and |h| < 2.5. The data are corrected and compared with PYTHIA Tune DW at the generator level. • CMS preliminary data at 900 GeV and 7 TeV on the “transverse” charged particle density, dN/dhdf, as defined by the leading charged particle jet (chgjet#1) for charged particles with pT > 0.5 GeV/c and |h| < 2. The data are uncorrected and compared with PYTHIA Tune DW after detector simulation. Rick Field – Florida/CDF/CMS
PYTHIA Tune DW CMS ATLAS • ATLAS preliminary data at 900 GeV and 7 TeV on the “transverse” charged PTsum density, dPT/dhdf, as defined by the leading charged particle (PTmax) for charged particles with pT > 0.5 GeV/c and |h| < 2.5. The data are corrected and compared with PYTHIA Tune DW at the generator level. • CMS preliminary data at 900 GeV and 7 TeV on the “transverse” charged PTsum density, dPT/dhdf, as defined by the leading charged particle jet (chgjet#1) for charged particles with pT > 0.5 GeV/c and |h| < 2. The data are uncorrected and compared with PYTHIA Tune DW after detector simulation. Rick Field – Florida/CDF/CMS
Charged Particle Density New Large increase in the UE in going from 1.96 TeV to 7 TeV as predicted by PYTHIA Tune DW! • CDF data at 1.96 TeV on the density of charged particles, dN/dhdf, with pT > 0.5 GeV/c and |h| < 1 for Drell-Yan production as a function of PT(Z) for the “toward”, “away”, and “transverse” regions compared with PYTHIA Tune DW. CMS CDF: Proton-Antiproton Collisions at 1.96 GeV Lepton Cuts: pT > 20 GeV |h| < 1.0 Mass Cut: 70 < M(lepton-pair) < 110 GeV Charged Particles: pT > 0.5 GeV/c |h| < 1.0 CMS: Proton-Proton Collisions at 7 GeV Lepton Cuts: pT > 20 GeV |h| < 2.4 Mass Cut: 60 < M(lepton-pair) < 120 GeV Charged Particles: pT > 0.5 GeV/c |h| < 2.0 • CMS data at 7 TeV on the density of charged particles, dN/dhdf, with pT > 0.5 GeV/c and |h| < 2 for Drell-Yan production as a function of PT(Z) for the “toward”, “away”, and “transverse” regions compared with PYTHIA Tune DW. Rick Field – Florida/CDF/CMS
Charged PTsum Density New Large increase in the UE in going from 1.96 TeV to 7 TeV as predicted by PYTHIA Tune DW! • CDF data at 1.96 TeV on the charged PTsum density, dPT/dhdf, with pT > 0.5 GeV/c and |h| < 1 for Drell-Yan production as a function of PT(Z) for the “toward”, “away”, and “transverse” regions compared with PYTHIA Tune DW. CMS • CMS data at 7 TeV on the charged PTsum density, dPT/dhdf, with pT > 0.5 GeV/c and |h| < 1 for Drell-Yan production as a function of PT(Z) for the “toward”, “away”, and “transverse” regions compared with PYTHIA Tune DW. Rick Field – Florida/CDF/CMS
PYTHIA Tune DW Overall PYTHIA Tune DW is in amazingly good agreement with the Tevatron Jet production and Drell-Yan data and did a very good job in predicting the LHC Jet production and Drell-Yan data! (although not perfect) CMS Rick Field – Florida/CDF/CMS
PYTHIA Tune Z1 • All my previous tunes (A, DW, DWT, D6, D6T, CW, X1, and X2) were PYTHIA 6.4 tunes using the old Q2-ordered parton showers and the old MPI model (really 6.2 tunes)! PARP(90) PARP(82) Color • I believe that it is time to move to PYTHIA 6.4 (pT-ordered parton showers and new MPI model)! Connections Diffraction • Tune Z1: I started with the parameters of ATLAS Tune AMBT1, but I changed LO* to CTEQ5L and I varied PARP(82) and PARP(90) to get a very good fit of the CMS UE data at 900 GeV and 7 TeV. • The ATLAS Tune AMBT1 was designed to fit the inelastic data for Nchg ≥ 6 and to fit the PTmax UE data with PTmax > 10 GeV/c. Tune AMBT1 is primarily a min-bias tune, while Tune Z1 is a UE tune! UE&MB@CMS Rick Field – Florida/CDF/CMS
PYTHIA Tune Z1 Parameters not shown are the PYTHIA 6.4 defaults! Rick Field – Florida/CDF/CMS
CMS UE Data CMS CMS Tune Z1 Tune Z1 • CMS preliminary data at 900 GeV and 7 TeV on the “transverse” charged PTsum density, dPT/dhdf, as defined by the leading charged particle jet (chgjet#1) for charged particles with pT > 0.5 GeV/c and |h| < 2.0. The data are corrected and compared with PYTHIA Tune Z1 at the generator level. • CMS preliminary data at 900 GeV and 7 TeV on the “transverse” charged particle density, dN/dhdf, as defined by the leading charged particle jet (chgjet#1) for charged particles with pT > 0.5 GeV/c and |h| < 2.0. The data are corrected and compared with PYTHIA Tune Z1 at the generator level. CMS corrected data! CMS corrected data! Very nice agreement! Rick Field – Florida/CDF/CMS
ATLAS UE Data ATLAS ATLAS Tune Z1 Tune Z1 • ATLAS published data at 900 GeV and 7 TeV on the “transverse” charged particle density, dN/dhdf, as defined by the leading charged particle (PTmax) for charged particles with pT > 0.5 GeV/c and |h| < 2.5. The data are corrected and compared with PYTHIA Tune Z1 at the generator level. • ATLAS published data at 900 GeV and 7 TeV on the “transverse” charged PTsum density, dPT/dhdf, as defined by the leading charged particle (PTmax) for charged particles with pT > 0.5 GeV/c and |h| < 2.5. The data are corrected and compared with PYTHIA Tune Z1 at the generrator level. ATLAS publication – arXiv:1012.0791 December 3, 2010 Rick Field – Florida/CDF/CMS
CMS-ATLAS UE Data CMS: Chgjet#1 Tune Z1 Tune Z1 ATLAS: PTmax • CMS preliminary data at 7 TeV on the “transverse” charged particle density, dN/dhdf, as defined by the leading charged particle jet (chgjet#1) for charged particles with pT > 0.5 GeV/c and |h| < 2.0 together with the ATLAS published data at 7 TeV on the “transverse” charged particle density, dN/dhdf, as defined by the leading charged particle (PTmax) for charged particles with pT > 0.5 GeV/c and |h| < 2.5 The data are corrected and compared with PYTHIA Tune Z1 at the generator level. Amazing agreement! Rick Field – Florida/CDF/CMS
Jet Radius Dependence The UE activity is higher for large jet radius! Tune Z1 • The charged particle density in the “transverse” region as defined by the leading charged particle jet from PYTHIA Tune Z1. The charged particles are in the region pT > 0.5 GeV/c and |h| < 2.5. Charged particle jets are constructed using the Anti-KT algorithm with d = 0.2, 0.5, and 1.0 from charged particles in the region pT > 0.5 GeV/c and |h| < 2.5, however, the leading charged particle jet is required to have |h(chgjet#1)| < 1.5. It seems that large jet radius “biases” the UE to be more active! Rick Field – Florida/CDF/CMS
ALICE UE Data ALICE ALICE Tune Z1 Tune Z1 • ALICE preliminary data at 900 GeV and 7 TeV on the “transverse” charged particle density, dN/dhdf, as defined by the leading charged particle (PTmax) for charged particles with pT > 0.5 GeV/c and |h| < 0.8. The data are corrected and compared with PYTHIA Tune Z1 at the generator level. • ALICE preliminary data at 900 GeV and 7 TeV on the “transverse” charged PTsum density, dPT/dhdf, as defined by the leading charged particle (PTmax) for charged particles with pT > 0.5 GeV/c and |h| < 0.8. The data are corrected and compared with PYTHIA Tune Z1 at the generrator level. ALICE UE Data: Talk by S. Vallero MPI@LHC 2010 Glasgow, Scotland November 30, 2010 I read the points off with a ruler! Rick Field – Florida/CDF/CMS
PYTHIA Tune Z1 Tune Z1 describes the energy dependence fairly well! CMS • CDF data at 1.96 TeV on the density of charged particles, dN/dhdf, with pT > 0.5 GeV/c and |h| < 1 for Drell-Yan production as a function of PT(Z) for the “toward”, “away”, and “transverse” regions compared with PYTHIA Tune Z1. • CMS data at 7 TeV on the density of charged particles, dN/dhdf, with pT > 0.5 GeV/c and |h| < 2 for Drell-Yan production as a function of PT(Z) for the “toward”, “away”, and “transverse” regions compared with PYTHIA Tune Z1. Rick Field – Florida/CDF/CMS
PYTHIA Tune Z1 CMS • CDF data at 1.96 TeV on the charged PTsum density, dPT/dhdf, with pT > 0.5 GeV/c and |h| < 1 for Drell-Yan production as a function of PT(Z) for the “toward”, “away”, and “transverse” regions compared with PYTHIA Tune Z1. • CMS data at 7 TeV on the charged PTsum density, dPT/dhdf, with pT > 0.5 GeV/c and |h| < 2 for Drell-Yan production as a function of PT(Z) for the “toward”, “away”, and “transverse” regions compared with PYTHIA Tune Z1. Rick Field – Florida/CDF/CMS
PYTHIA Tune Z1 Tune Z1 Tune Z1 • CMS data at 900 GeV on the “transverse” charged particle density, dN/dhdf, as defined by the leading charged particle jet (chgjet#1) for charged particles with pT > 0.5 GeV/c and |h| < 2.0. The data are corrected and compared with PYTHIA Tune Z1 at the generator level. • CDF data at 1.96 TeV on the “transverse” charged particle density, dN/dhdf, as defined by the leading calorimeter jet (jet#1) for charged particles with pT > 0.5 GeV/c and |h| < 1.0. The data are corrected and compared with PYTHIA Tune Z1 at the generator level. Rick Field – Florida/CDF/CMS
PYTHIA Tune Z1 Tune Z1 Tune Z1 • CDF data at 1.96 TeV on the “transverse” charged PTsum density, dPT/dhdf, as defined by the leading calorimeter jet (jet#1) for charged particles with pT > 0.5 GeV/c and |h| < 1.0. The data are corrected and compared with PYTHIA Tune Z1 at the generator level. • CMS data at 900 GeV and 7 TeV on the “transverse” charged PTsum density, dPT/dhdf, as defined by the leading charged particle jet (chgjet#1) for charged particles with pT > 0.5 GeV/c and |h| < 2.0. The data are corrected and compared with PYTHIA Tune Z1 at the generator level. Rick Field – Florida/CDF/CMS
PYTHIA Tune Z1 Tune Z1 Tune Z1 Tune Z1 Tune Z1 Rick Field – Florida/CDF/CMS
PYTHIA Tune Z1 Overall amazingly good agreement with the LHC and Tevatron Jet production and Drell-Yan! (although not perfect yet) Tune Z1 Tune Z1 Tune Z1 Tune Z1 Rick Field – Florida/CDF/CMS
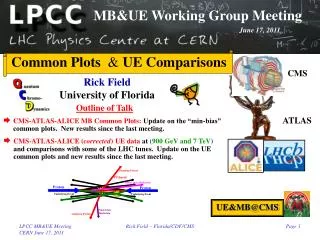
MB&UE Working Group MB & UE Common Plots CMS ATLAS • The LPCC MB&UE Working Group has suggested several MB&UE “Common Plots” the all the LHC groups can produce and compare with each other. Rick Field – Florida/CDF/CMS
CMS Common Plots Direct charged particles (including leptons) corrected to the particle level with no corrections for SD or DD. Rick Field – Florida/CDF/CMS
ATLAS UE Data ATLAS ATLAS Tune Z1 Tune Z1 • ATLAS preliminary data at 900 GeV and 7 TeV on the “transverse” charged PTsum density, dPT/dhdf, as defined by the leading charged particle (PTmax) for charged particles with pT > 0.5 GeV/c and |h| < 0.8. The data are corrected and compared with PYTHIA Tune Z1 at the generrator level. • ATLAS preliminary data at 900 GeV and 7 TeV on the “transverse” charged particle density, dN/dhdf, as defined by the leading charged particle (PTmax) for charged particles with pT > 0.5 GeV/c and |h| < 0.8. The data are corrected and compared with PYTHIA Tune Z1 at the generator level. ATLAS-CONF-2011-009 February 21, 2011 Rick Field – Florida/CDF/CMS
ALICE-ATLAS UE ALICE ATLAS Tune Z1 Tune Z1 • ALICE preliminary data at 900 GeV and 7 TeV on the “transverse” charged particle density, dN/dhdf, as defined by the leading charged particle (PTmax) for charged particles with pT > 0.5 GeV/c and |h| < 0.8. The data are corrected and compared with PYTHIA Tune Z1 at the generator level. • ATLAS preliminary data at 900 GeV and 7 TeV on the “transverse” charged particle density, dN/dhdf, as defined by the leading charged particle (PTmax) for charged particles with pT > 0.5 GeV/c and |h| < 0.8. The data are corrected and compared with PYTHIA Tune Z1 at the generrator level. Rick Field – Florida/CDF/CMS
ALICE-ATLAS UE ALICE ATLAS Tune Z1 Tune Z1 • ALICE preliminary data at 900 GeV and 7 TeV on the “transverse” charged particle density, dN/dhdf, as defined by the leading charged particle (PTmax) for charged particles with pT > 0.5 GeV/c and |h| < 0.8. The data are corrected and compared with PYTHIA Tune Z1 at the generator level. • ATLAS preliminary data at 900 GeV and 7 TeV on the “transverse” charged particle density, dN/dhdf, as defined by the leading charged particle (PTmax) for charged particles with pT > 0.5 GeV/c and |h| < 0.8. The data are corrected and compared with PYTHIA Tune Z1 at the generrator level. Rick Field – Florida/CDF/CMS
Tevatron Energy Scan • Just before the shutdown of the Tevatron CDF has collected more than 10M “min-bias” events at several center-of-mass energies! 900 GeV 300 GeV 1.96 TeV 300 GeV 12.1M MB Events 900 GeV 54.3M MB Events Rick Field – Florida/CDF/CMS
New CDF Energies Tune Z1 • ATLAS preliminary data at 900 GeV and 7 TeV on the “transverse” charged particle density, dN/dhdf, as defined by the leading charged particle (PTmax) for charged particles with pT > 0.5 GeV/c and |h| < 0.8. The data are corrected and compared with PYTHIA Tune Z1 at the generator level. • Predictions for CDF on the “transverse” charged particle density, dN/dhdf, as defined by the leading charged particle (PTmax) for charged particles with pT > 0.5 GeV/c and |h| < 0.8 from PYTHIA Tune Z1 at the generator level. • Very very preliminary CDF data at 900 GeV and 1.96 TeV on the “transverse” charged particle density, dN/dhdf, as defined by the leading charged particle (PTmax) for charged particles with pT > 0.5 GeV/c and |h| < 1.0. Rick Field – Florida/CDF/CMS
My CDF UE Plan • Produce the CDF PTmax UE “common plots” at 900 GeV to compare with ALICE-ATLAS-CMS. Must correct the data to the particle level! • Study the energy dependence of the PTmax UE (300 GeV, 900 GeV, 1.96 TeV) at CDF. Must correct the data to the particle level! Rick Field – Florida/CDF/CMS
My CDF MB Plan • Produce the CDF MB “common plots” at 900 GeV to compare with ALICE-ATLAS-CMS. I would be very happy if someone would help with the MB. It comes along with the UE analysis without much extra work! • Study the energy dependence of MB (300 GeV, 900 GeV, 1.96 TeV) at CDF. I would be very happy if someone would help with the MB. It comes along with the UE analysis without much extra work! Rick Field – Florida/CDF/CMS