Dimensions Explained: A Visual Guide to Multivariate Information with Dimensional Anchors
Explore the innovative concept of Dimensional Anchors – a graphic primitive designed for multidimensional and multivariate information visualizations. This concept, developed by Patrick Hoffman and Georges Grinstein of UMass-Lowell, enables a comprehensive understanding of data through Parallel Coordinates, Survey Plots, Scatter Plots, Radviz, and Circle Segments. By utilizing parameters and colorization techniques, Dimensional Anchors enhance data interpretation and analysis. Discover examples of Dimensional Anchors in action through Scatterplot, Survey Plot, Parallel Coordinate, and Radviz/Spring examples. Unveil the potential configurations and possibilities offered by utilizing Dimensional Anchors for your data visualization needs.

Dimensions Explained: A Visual Guide to Multivariate Information with Dimensional Anchors
E N D
Presentation Transcript
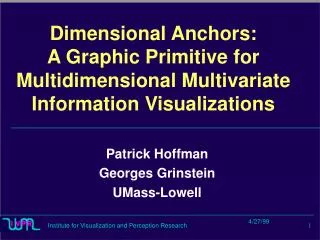
Dimensional Anchors: A Graphic Primitive for Multidimensional Multivariate Information Visualizations Patrick Hoffman Georges Grinstein UMass-Lowell
Background • Parallel Coordinates • Survey Plot • Scatter Plot (Scatter Plot Matrix) • Radviz (spring forces) • Circle Segments
Basic level, a DA is an Axis in a ScatterPlot • Associated with a Data Column (Dataset) • Anchorpoints (data points along the Axis)
Currently 9 Geometrical Parameters for a DA • P1- Size of scatterplot point • P2 - Length of perpendicular lines extending from anchorpoints,creating scatterplot points • P3 - length of lines connecting points associated with the same data point in scatter plot • P4 - length of rectangle in Survey Plot (has a threshold feature) • P5 - length of Parallel Coordinate lines • P6 - blocking factor for Parallel Coordinate lines • P7 - size of Radviz/spring plot point • P8 - length of “spring” lines extending from anchorpoints creating Radviz/spring plot point • P9 - zoom factor for the “spring” K constant
Currently 4 Data/Color Parameters for a DA • An associated data column for anchorpoints • An associated data column for colorizing • An associated data column for sorting (Survey Plot parameter only) • An associated color palette value (different color tables)
DAs do not currently use Oblique Coordinates
Currently 9 Parameters For a Dimensional Anchor • P1 - Size of scatterplot point • P2 - Length of perpendicular lines extending from anchorpoints,creating scatterplot points • P3 - length of lines connecting points associated with the same data point in scatter plot • P4 - length of rectangle in Survey Plot (has a threshold feature) • P5 – length of Parallel Coordinate lines • P6 – blocking factor for Parallel Coordinate lines • P7 – size of Radviz/spring plot point • P8 – length of “spring” lines extending from anchorpoints creating Radviz/spring plot point • P9 – zoom factor for the “spring” K constant
Some DA-Survey plot Examples Data is sorted by some column
Currently 9 Parameters For a Dimensional Anchor • P1 - Size of scatterplot point • P2 - Length of perpendicular lines extending from anchorpoints,creating scatterplot points • P3 - length of lines connecting points associated with the same data point in scatter plot • P4 - length of rectangle in Survey Plot (has a threshold feature) • P5 – length of Parallel Coordinate lines • P6 – blocking factor for Parallel Coordinate lines • P7 – size of Radviz/spring plot point • P8 – length of “spring” lines extending from anchorpoints creating Radviz/spring plot point • P9 – zoom factor for the “spring” K constant
Currently 9 Parameters For a Dimensional Anchor • P1 - Size of scatterplot point • P2 - Length of perpendicular lines extending from anchorpoints,creating scatterplot points • P3 - length of lines connecting points associated with the same data point in scatter plot • P4 - length of rectangle in Survey Plot (has a threshold feature) • P5 – length of Parallel Coordinate lines • P6 – blocking factor for Parallel Coordinate lines • P7 – size of Radviz/spring plot point • P8 – length of “spring” lines extending from anchorpoints creating Radviz/spring plot point • P9 – zoom factor for the “spring” K constant
There are many possible configurations (useful) of Dimensional Anchors