Download
1 / 54
540 likes | 726 Vues
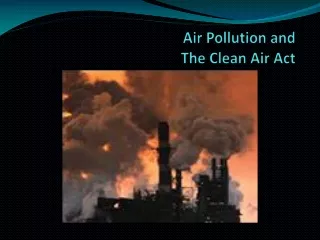
B. Clean Air and Water. Read the textbook for a history of regulations Try to remember the main environmental laws, even if you don’t remember all the amendments See also the six “criteria pollutants” targeted by the EPA

E N D
B. Clean Air and Water • Read the textbook for a history of regulations • Try to remember the main environmental laws, even if you don’t remember all the amendments • See also the six “criteria pollutants” targeted by the EPA • Compare the book’s emphasis on problems and crises to Assignment 2 – have the regulations worked? (More on this in a few minutes)
C. Particulate Matter • Textbook has information on previous regulations – this section focuses on more recent developments
1. PM 2.5 • Particulate Matter less than 2.5 microns (about 1/20 the width of a human hair) • Consensus says 2.5 microns and below is most dangerous to human health • One study’s finding: decrease soot by 1 microgram/cubic meter 3% fewer deaths from respiratory/cardiovascular disease • More than 2000 peer-reviewed studies agree that PM 2.5 is hazardous to health. EPA estimate = 20,000 deaths/year
2. Levels of PM 2.5 • Harvard “Six Cities Study” Data:
a. Current levels of PM 2.5 • Fluctuates over time and space • Texas
VI. Trends and Policies • Is pollution increasing or decreasing in the US? (Assignment 2 used global, not national, data). CO2 already covered. Some more examples to consider: • Major industries – Power plants, chemical industry, refining, mining, agriculture
c. Refineries: Carcinogens · Excluding BP Texas City, the refinery industry reported a 13% decrease in emissions of carcinogens between 1999 and 2004.
d. Mining and Agriculture • Little data available on mining – reporting not required for most pollutants (i.e. cyanide) • Agriculture: Major pollutants are methane, fertilizer runoff, and POPs (pesticides)
No data on runoff. • Fertilizer use
3. Toxic Chemicals a. Mercury
4. Other Criteria Pollutants (Air) a. Ozone
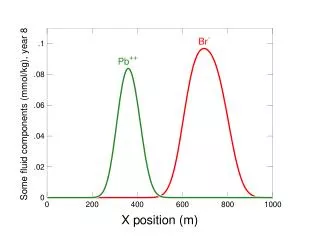
6. Water Pollution • Little long-term data like that for air pollution. Best estimates are probably water quality measures
B. Is Pollution Too High? 1. Legal standards: 40% of Americans breathe polluted air and 8-10% drink water from violating sources
C. Costs of Regulation 1. Growth can coexist with pollution reduction
2. Typical cost curves • Marginal costs of pollution control usually increase. Why? Costs 0 25% 50% 75% 100% Pollution Reduction
Possible Benefits Curves • Marginal costs of pollution control usually increase. Why? • Need to know size and shape of benefits curve (generally linear or diminishing returns) Costs 0 25% 50% 75% 100% Pollution Reduction
3. The Apple-Orange Problem • Costs are largely economic: pollution control / prevention costs money – and other things one can buy with money. • Benefits are only partly economic: Fewer health problems means more hours worked and less spent on medical care – but also keeps Grandma alive for her grandkids!
Coal Processing Plant, Bigler, PA • The coal chute crosses a road
Coal Processing Plant, Bigler, PA • Across the road is a house
The Story • Coal plant begins operating in 1981 • Coal chute is uncovered coal dust blankets nearby homes for years • Lawsuit in 1980s gains each family about $5000 in damages, agreement to cover chute • Violet awarded more than others since she lived next to the chute and experienced chronic respiratory distress BUT pretrial agreement divides all awards evenly between all plaintiffs • Violet’s respiratory symptoms are severe by the time the lawsuit is concluded