Download
1 / 9
90 likes | 213 Vues
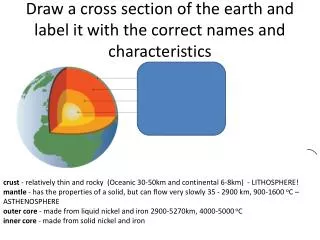
PARTICIPANTS will draw a cross-section and apply the three soils to the landscape. 1. Develop a Cross-section 2. Place the stratigraphic line for the parent materials. (loess has a higher Ksat than till).

E N D
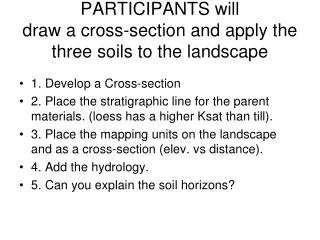
PARTICIPANTS willdraw a cross-section and apply the three soils to the landscape • 1. Develop a Cross-section • 2. Place the stratigraphic line for the parent materials. (loess has a higher Ksat than till). • 3. Place the mapping units on the landscape and as a cross-section (elev. vs distance). • 4. Add the hydrology. • 5. Can you explain the soil horizons?
Map unit Info. • 17B till (Barnes) • 40B glacial lacustrine (Gardinia) • 83F shale (Kloten) • 9B colluvium (Nutley) • 56 alluvium (Lydell)
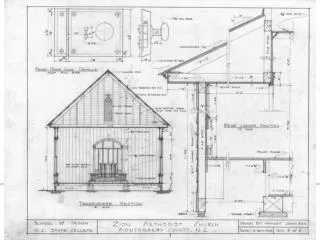
Step 1. Build a slope profile (cross-section): On topographic mark a traverse line across map & mark the points of intersection between the traverse line and major contours (on flat areas may need to use minor contours as well). b. On paper (or computer screen) plot Elevation vs. Distance; draw down to a base elevation. Traverse line Water 1400 1350 Contour Interval (CI) is the # of lines (5) between bold elevations. Bold elevations = 50 feet. (CI = 10 Feet). Elevation (ft) 1300’ 1250 1200 0 Distance (ft) 5000
Step 2. Add slope Profile Step 2.a. Added Green dotted line from topog 2b. Added green line from WSS – Till and Loess above and shale below (Kloten soil). 2b. Added green line from WSS – Till and Loess above and shale below (Kloten soil). Water 17B Barnes 1400’ 1350’ From WSS and Topog. Added two lines 83F Kloten (shale) On both the topo. sheet and the Web Soil Surv. could see an area with back-rotation (top of a landslide). Added dashed green line to show steep head scarp of landslide – see Handy’s illustration. Would you build a house to see the view here? Assumed from the soils that till and loess above and 83 F Kloten (shale) below that somewhere inbetween the till ends and shale starts. (Read that in soil survey report and OSD). 9B Nutley (colluv.) 56 Lydell (alluv.) Shey. River
Step 3. Add Hillslope Profile positions & Estimated Hydrology (blue lines). Su Water Bs Step 4. Add landslide fractures (black lines). Shey. River FS TS
JLR DREW THIS SKETCH BY LOOKING A TOPOGRAPHIC MAP AND SIMPLY “EYEBALLING IT” Note: You can adjust the vertical / horizontal ratio as desired (e.g. vertical or lateral scale exaggeration).