Download
1 / 6
70 likes | 211 Vues
This document covers the fundamental aspects of polynomial functions, including solving polynomial equations and identifying their attributes such as domain, range, degree, relative maxima/minima, and zeros. It explains the standard form of polynomials as sums of monomials and discusses classifications including constant, linear, quadratic, and higher-order polynomials. Additionally, it addresses end behavior, turning points, and provides instructions for graphing functions accurately. By mastering these concepts, students will be equipped to model real-world situations using polynomial functions.

E N D
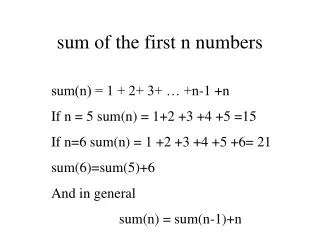
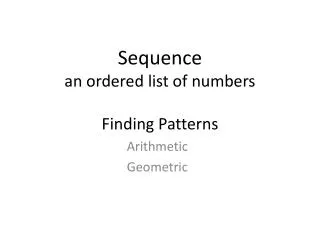
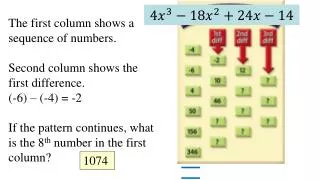
The first column shows a sequence of numbers. Second column shows the first difference. (-6) – (-4) = -2 If the pattern continues, what is the 8th number in the first column? 1074
Polynomial Functions 5-1 Unit Objectives: Solve polynomial equations Identify function attributes: domain, range, degree, relative maximums/minimums, zeros Write and graph polynomial functions Model situations with polynomial functions Today’s Objective: I can describe polynomial functions.
Polynomial Function: Standard Form Polynomial: sum of monomials (terms) Degree of a polynomial: highest exponent Standard form: terms arranged by exponents in descending order Monomialterm Coefficient Real Number DegreeNonnegative integer Example:
Classifying Polynomial Constant Monomial Linear Binomial Quadratic Trinomial Cubic polynomial of n terms Quartic Quintic nthdegree Write in standard form. Classify by degree & Terms quartic polynomial of 4 terms
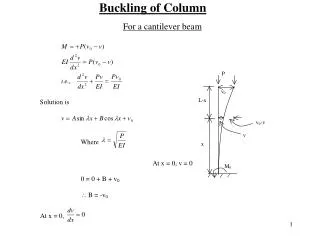
End Behavior and Turning Points Graph on your calculator window:[-5, 5, 1, -5, 5, 1] Graph each equation below Sketch each graph in your notes • a > 0 • ↑ and ↑ • ↓ and ↑ • a < 0 • ↑ and ↓ • ↓ and ↓ Turning Points: • At most n – 1
Describing the shape of the graph End Behavior: Turning points: Increasing/decreasing intervals: Up and down Relative Maximum • (0.82, 1.09) At most two Decreasing: − ∞ to − 0.82 Relative Minimum Increasing: − 0.82 to 0.82 (-0.82, -1.09) Decreasing: + 0.82 to ∞ Pg. 285: #8-36 even, 47- 49