Download
1 / 85
850 likes | 945 Vues
This campaign monitoring research conducted by the Ministry of Civil Defence & Emergency Management in July 2011 aims to assess the effectiveness of the Get Ready Get Thru social marketing campaign in increasing people's level of preparedness for disasters. The survey methodology involved random telephone interviews across New Zealand to measure disaster preparedness and analyze the impact of recent events such as the Christchurch earthquakes on public awareness and readiness. The findings indicate a significant increase in preparedness levels, with more people taking steps to prepare themselves or their households following the earthquakes. The report also highlights changing perceptions regarding potential disasters such as earthquakes and storms, as well as the importance of having emergency survival plans in place. Overall, the survey shows a positive shift in New Zealand's state of preparedness for emergencies.

E N D
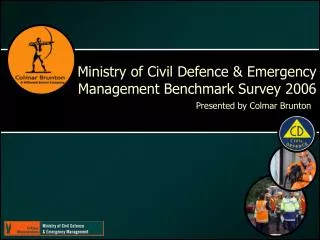
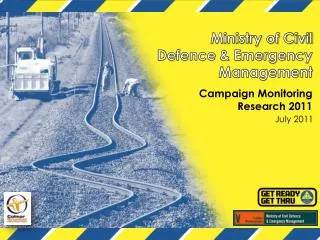
Ministry of Civil Defence & Emergency ManagementCampaign Monitoring Research 2011 July 2011
Background and objectives Background The Ministry of Civil Defence and Emergency Management needs to shift people’s level of preparedness for disasters. The Get Ready Get Thru social marketing campaign began in June 2006 and has now been running for five years. This survey builds upon a previous April-May 2006 pre-campaign benchmark survey, and four annual tracking surveys conducted in April-May 2007-2010. Objective To measure people’s disaster preparedness, and to assess the effectiveness of the campaign over time.
How the survey was carried out Methodology • Random telephone interviewing of people living in New Zealand (n=1164, aged 15+). • Methodology is very similar to that used in the benchmark and the five annual measures, with the exception that additional interviews were carried out to allow more robust regional analyses this year. • Maximum margin of error of +/- 3.1% at the 95% confidence level (for a stratified random sample). • Due to the February earthquake in Christchurch, fieldwork was delayed by approximately four weeks, and was carried out between 16 May and 12 June this year. • Christchurch residents were not interviewed this year. Given the ongoing aftershocks and impact of the earthquakes on Christchurch residents it would have been inappropriate to question them about their awareness of, and preparedness for, disasters. • In order to accurately compare preparedness this year with people’s preparedness in 2010, all the 2010 results were recalculated with Christchurch city residents excluded. Excluding Christchurch residents had almost no impact on the 2010 findings. Where percentages did differ slightly, in the body of this report we have presented the ‘excluding Christchurch result’ for 2010 in parentheses. The 2010 figures in the Executive Summary are all ‘excluding Christchurch’ figures. • The overall results have been weighted to 2006 Census figures (excluding Christchurch) to adjust for the fact that some regions were ‘oversampled’ this year, and to align the data with Census counts for age and gender. Consideration of the Christchurch earthquakes for this year’s survey
Executive summary The impact of the Christchurch earthquakes on those living outside Christchurch • Findings show that recent events have had a significant impact on people’s disaster awareness and preparedness. • Sixty percent say they have taken steps to prepare themselves or their household in the last 12 months, up from 44% last year. The main prompt for doing so was the Christchurch earthquakes (65% of those who said they did something to prepare themselves or their household said (unprompted) that this was due to the Christchurch earthquakes). • After prompting, 60% said they did something to prepare as a direct result of either the September or February earthquake – 38% prepared emergency survival items and one quarter (25%) formulated a survival plan. • People are more aware that earthquakes (up from 92% to 97%) and hurricanes, cyclones, or storms (up from 31% to 53%) could happen in New Zealand in their lifetime. • More people agree that in a disaster there will be someone there to help you (up from 65% to 74%) and that in a disaster, emergency services would be there to help you (up from 65% to 75%). They are less likely to agree that there will always be adequate warning before disaster hits (down from 37% to 28%).
Executive summary (continued) • People are more likely to say their local or regional council (up from 38% to 48%), the ambulance service (up from 67% to 71%) and their neighbours (up from 80% to 84%) will be there to help them following a disaster. • More people believe that sewerage services (up from 82% to 88%) could be disrupted following a disaster. The proportion of people who believe that mobile phone services could be disrupted has increased gradually throughout the course of the campaign, from 56% in 2007, to 59% in 2008, to 62% in 2009, to 69% in 2010, and to 73% in 2011. • There is greater awareness of the need to have an emergency survival plan. Nearly half (47%) said unprompted that households should prepare an emergency survival plan for when disaster strikes (up from 39% in 2010).
Executive summary (continued) New Zealand’s state of preparedness • New Zealand’s state of preparedness has increased substantially. • Nearly one fifth (18%) are fully prepared for an emergency, up from 11% in 2010. Being fully prepared means having an emergency survival plan that includes what to do when away from home, having emergency survival items and water, and regularly updating these items. • Nearly a third (32%) are prepared for an emergency when at home – 23% were prepared at home in 2010. Being prepared at home means having an emergency survival plan, having emergency survival items and water, and regularly updating these items. • More than four out of five (84%) now have emergency survival items (up from 79% in 2010), just under two thirds (63%) have a survival plan (up from 47% in 2010), and 30% have a plan that includes what to do when away from home (up from 21% in 2010). • Those more at risk when disaster strikes include students, those who identify with ethnic groups other than New Zealand European or Maori, and those for whom English is not a first language. • We asked those who believe preparedness is important for the reasons why they have not prepared. The main barrier is ‘not getting around to it’ (32%). Cost is more of a barrier this year (16%, up from 11% in 2010).
Executive summary (continued) How well is the advertising working? • The advertising campaign remains well received. • As in 2010, four out of five people who have seen the ads (81%) have been prompted to think or take action to prepare for a disaster: • Forty two percent have been prompted to make a survival kit (up from 38% in 2010) • Thirty seven percent have been prompted to make a survival plan (up from 31% in 2010) • Sixty percent have been prompted to talk with family or friends (up from 48% in 2010) • Diagnostically, the TV ads continue to work well. The vast majority who have seen the ads understand them (98%) and find the points believable (96%), relevant (89%), and helpful (94%). • The majority of people who have seen the ads find them enjoyable to watch (77%) and feel that the ads contain new information (58%). • Public awareness of Civil Defence TV advertisements has decreased 5 percentage points, from 68% in 2010 to 63% this year. This is not surprising given that the March Get Ready Get Thru advertising was cancelled following the February earthquake.
Executive summary (continued) • The tag line ‘Get Ready, Get Thru’ is becoming increasingly familiar to people. Awareness of the tag line has increased from 41% in 2009, to 47% in 2010, to 49% this year. • Awareness of the Get Thru website is at 40%, compared to 38% in 2010. When asked where to find information before a disaster, people are more likely to say unprompted that they can get information from a Civil Defence website (up from 37% in 2010 to 44% this year).
Events and situations that may have influenced awareness of, and preparedness for, disasters in 2011
Putting the survey into context… Before interpreting research results it is useful to consider the context, or events that occurred, prior to fieldwork (16 May to 12 June 2011). • Factors that may have influenced the results include: • Earthquakes (September and February) and aftershocks in Christchurch, and continued media coverage (fieldwork was completedbefore June 13 quakes) • March Get Ready Get Thru TV advertising was cancelledfollowing February earthquake • Volcanic eruptions in Chile (June) and Iceland (May) • Tornado in Albany (May) • Floods in Mississippi (May) • Earthquake and tsunami in Japan (March) • Cyclone Yasi hit northern Queensland (February) • Floods in Queensland (December/January) • Pike River Mine disaster (November)
There is greater awareness of potential earthquakes and storms this year. Possible disasters in your lifetime Awareness of tsunami increased in 2010, and has remained high this year relative to 2009. (53) (53) 1% of respondents mentioned mining disasters this year. This has not been mentioned previously. Mentions of mining disasters were highest on the West Coast (3%). (5) Q1 First I’d like to ask about the types of major disasters that could happen in New Zealand. What types of disasters can you think of that could happen in New Zealand in your lifetime? Base: All Respondents: Benchmark (n= 1001), 2007 (n= 1000), 2008 (n= 1016), 2009 (n=1000), 2010 (n=1000), 2011 (n=1164). Note: Only the top ten disasters for 2011 are shown.
There have been increases in non-advertising preparedness messages from a range of sources. Sources of non-advertising preparedness messages (31) (17) As may be expected given recent events, there have been significant increases in non-advertising preparedness messages this year on TV, in newspapers, over the radio, on the internet, and through word of mouth. (7) (4) Q22a Other than in any advertising, where else have you seen or heard other messages or information about disasters? Base: All Respondents, 2009 (n = 1000), 2010 (n=1000), 2011 (n=1164) Note: Statements 2% and below not shown.
How have the Canterbury earthquakes influencedNew Zealand’s preparedness?
Don’t know Slightly disagree Slightly agree Strongly agree Strongly disagree Attitudes toward disasters have changed. % agree Benchmark 2007 2008 2009 2010 2011 61 67 71 76 64 74 This year through the media we have witnessed the response of the Government, Civil Defence, local authorities, emergency services, the New Zealand public and the local community to the Christchurch earthquakes. This appears to have produced greater confidence that someone will be there to help. In a disaster there will be someone there to help you (65) Benchmark 2007 2008 2009 2010 2011 65 70 75 77 65 75 In a disaster, emergency services would be there to help you Benchmark 2007 2008 2009 2010 2011 25 31 30 38 36 28 There will always be adequate warning before disaster hits This year more people appreciate that a disaster could strike at any time. (37) Benchmark 2007 2008 2009 2010 2011 94 97 98 98 99 98 It’s my responsibility to look after myself & family in a disaster Q2 On a scale of strongly agree, slightly agree, slightly disagree and strongly disagree, how much do you agree or disagree with the following statements? Base: All Respondents: Benchmark (n=1001), 2007 (n= 1000), 2008 (n=1016), 2009 (n=1000), 2010 (n=1000), 2011 (n=1164).
We expect to rely more on our local or regional council than we did last year. Who would be able to help following a disaster? More people believe their local or regional council, their neighbours, and the ambulance service will be there to help them following a disaster. (80) (77) (67) (61) (62) Q7. Now I’d like you to imagine that there has been a disaster in the town, city or rural area where you live. What groups or individuals do you think would be able to help you following a disaster? Base: All Respondents: 2007 (n= 1000), 2008 (n=1016), 2009 (n=1000), 2010 (n=1000), 2011 (n=1164).
People have become more aware that mobile phone and sanitation services could be disrupted following a disaster. Which services could be disrupted? (87) (82) Q8 Still imagining there had been a disaster, some of the normal services may not be available. Which of the following household utilities or infrastructure services do you think could be disrupted? Base: All Respondents: 2007 (n= 1000), 2008 (n=1016), 2009 (n=1000), 2010 (n=1000), 2011 (n=1164).
Very important/prepared Not at all important/prepared Not that important/prepared Quite important/prepared People are more likely to say it’s ‘very important’ to be prepared this year. % important/prepared % of those who say it’s important who also say they are very or quite prepared 94 52 2006 – 54% 93 52 2007 – 54% 95 54 2008 – 56% 2009 – 52% 95 50 2010 – 54% 95 52 (96) 2011 – 62% 96 60 Self-rated preparedness has also increased, from 52% in 2010 to 60% this year. Q3 How important is it that you are prepared for a disaster? Is it… Q5. How well prepared for a disaster do you feel you are? Do you feel you are… Base: All Respondents: Benchmark (n=1001), 2007 (n= 1000), 2008 (n= 1016), 2009 (n=1000), 2010 (n=1000), 2011 (n=1164).
More people are aware of the need for an emergency survival plan this year. Unprompted awareness of what households should do to prepare for a disaster Q6a What things do you think households should do to prepare for a disaster? Base: All Respondents: 2009 (n=1000), 2010 (n=1000), 2011 (n=1164).Note: This question was asked for the first time in 2009.
60% say they have taken steps to prepare in the last 12 months. • People more likely to have taken steps to prepare: • Those aged 30 years or over (64%, cf. 48% of those under 30) • NZ European and Maori (61%, cf. 52% of others) • Those with a personal income over $100k (74%, cf. 59% of those earning less) • Those living in small towns or on farms (65%, cf. 58% of those living in main or provincial cities). (55) This is a substantial increase since the previous wave. (44) Q11a: In the last 12 months, have you taken any steps to prepare yourself or your household for a disaster? Base: All Respondents, 2009 (n = 1000), 2010 (n=1000), 2011 (n=1164)
Taken steps to prepare in the last 12 months. Northland 38% Average Waikato 43% Average 60% Hawkes Bay 76% Wellington 83% A higher than average proportion of Wellington, Hawkes Bay, and West Coast residents have taken steps to prepare in the last 12 months. A lower than average proportion of Northland and Waikato residents have taken steps to prepare. West Coast 78% Higher than average Below Average Note: Percentages are presented that are statistically higher or lower than the national average at the 95% confidence level. We have not calculated percentages for Canterbury because Christchurch city residents were not interviewed this year.
The Christchurch earthquakes were the main prompt for those who took steps to prepare. 65% specifically said (unprompted) that it was the Christchurch earthquakes that prompted them to take steps to prepare. Disasters that occurred in New Zealand (18) Disasters that occurred overseas 3% specifically mentioned the Queensland floods Advertising I saw/heard/read (24) News/article in the media (14) Friends or family Something I have always done My work/job training makes me aware (5) Just want to be prepared Common sense/sensible thing to Documentary on television (5) Q11b: What prompted you to do this? Base: Those who have taken steps towards preparing for a disaster in the last 12 months, 2009 (n = 422), 2010 (n = 465), 2011 (n = 726). Note: The top ten responses are shown.
When prompted, 60% of all those surveyed say they took steps to prepare as a result of either the February or September quake. Don’t know September earthquake Overall 60% say they took steps to prepare as a result of the two major earthquakes: 41% took action after the September quake and 47% took action after the February quake. Neither February earthquake Both earthquakes Q11c: Did either the September 2010 or February 2011 Christchurch earthquakes prompt you to take steps to prepare yourself or your household for a disaster? Base: All respondents (n=1164)
Taken steps to prepare as a result of the Christchurch earthquakes. Northland 38% Higher than average Bay of Plenty 47% Waikato 46% Average Below Average Taranaki 46% Average 60% Wellington 81% When prompted, a higher than average proportion of Wellington residents say they took steps to prepare as a result of the Christchurch earthquakes. A lower than average proportion of Northland, Bay of Plenty, Waikato, and Taranaki residents say they were prompted to prepare due to the Christchurch earthquakes. Note: Percentages are presented that are statistically higher or lower than the national average at the 95% confidence level. We have not calculated percentages for Canterbury because Christchurch city residents were not interviewed this year.
Of those who took steps to prepare,62% prepared survival items and41% formulated a survival plan. Similar responses in this table have been grouped into ‘nett categories’. These nett categories are shaded and in bold font. They show the proportion of respondents who gave at least one of the more detailed responses in that category. ‘Take other actions’ includes putting documents and valuables in a safe place (2%), securing household items (2%), checking insurance coverage (1%), reading Civil Defence advice (1%), and checking house structure (1%). Q11d: What was it the Christchurch earthquake(s) prompted you to do?Note: Comments below 2% are not shown.
The number of people with survival items, stored water, and a plan has increased since last wave. You have a good understanding of effects if disaster struck your area (81) You have good understanding of types of disasters that could occur in NZ & the chances of them occurring (80) You have the necessary emergency items needed to survive a disaster, e.g. tinned food etc You are familiar with CD info in Yellow Pages (61) You have an emergency survival plan for your household You regularly update your emergency survival items (45) You have stored 3L water pp for 3 days for household You attend meetings with community groups about disaster planning (8) None of these (2) Q10 Which of the following statements apply to you? Base: All Respondents: Benchmark (n= 1001), 2007 (n= 1000), 2008 (n= 1016), 2009 (n=1000), 2010 (n=1000), 2011 (n=1164)
84% have emergency survival items. Q10. You have necessary emergency items needed to survive a disaster, e.g. tinned food etc Base: All Respondents: Benchmark (n= 1001), 2007 (n= 1000), 2008 (n= 1016), 2009 (n=1000), 2010 (n=1000), 2011 (n=1000)
More people have a survival plan, and more include a plan for what to do when away from home. (26) *Percentages do not add to 100 due to rounding Q11 Does your survival plan include what to do when you are not at home? Base: All Respondents: Benchmark (n= 1001), 2007 (n= 1000), 2008 (n= 1016), 2009 (n=1000), 2010 (n=1000), 2011 (n=1164).
Nearly two thirds (63%) have a plan when at home. Higher than average Northland 45% Average Below Average Auckland 53% Average 63% Nelson / Tasman / Marlborough 80% Wellington, Nelson/Tasman/Marlborough, and West Coast residents are more likely than average to have a plan for when at home. Northland and Auckland residents are less likely to have a plan for when at home. Wellington 79% West Coast 79% Note: Percentages are presented that are statistically higher or lower than the national average at the 95% confidence level. We have not calculated percentages for Canterbury because Christchurch city residents were not interviewed this year.
One in three (30%) have a survival plan for when they are away from home. Auckland 23% Higher than average Average Below Average Nelson / Tasman / Marlborough 57% Average 30% Wellington 45% Wellington and Nelson/Tasman/Marlborough residents are more likely than average to have a plan for when they are away from home. Auckland residents are less likely to have a plan for when away from home. Note: Percentages are presented that are statistically higher or lower than the national average at the 95% confidence level. We have not calculated percentages for Canterbury because Christchurch city residents were not interviewed this year.
How prepared is New Zealand? Nearly one out of five are fully prepared. Have an emergency survival plan that includes what to do when not at home Regularly update emergency survival items Have emergency items and water • FULLY PREPARED = 18% • 11% - 2010 measure • 10% - 2009 measure • 10% - 2008 measure • 8% - 2007 measure • 7% - Benchmark
You have a good understanding of effects if disaster struck your area (81) You have good understanding of types of disasters that could occur in NZ & the chances of them occurring This change has been driven mostly by the substantial increase in the number of people with a survival plan. (80) You have the necessary emergency items needed to survive a disaster, e.g. tinned food etc You are familiar with CD info in Yellow Pages (61) You have an emergency survival plan for your household You regularly update your emergency survival items (45) You have stored 3L water pp for 3 days for household You attend meetings with community groups about disaster planning (8) None of these (2) Q10 Which of the following statements apply to you? Base: All Respondents: Benchmark (n= 1001), 2007 (n= 1000), 2008 (n= 1016), 2009 (n=1000), 2010 (n=1000), 2011 (n=1164)
Nearly one fifth (18%) are fully prepared. Higher than average Auckland 11% Average Below Average Average 18% Nelson / Tasman / Marlborough 37% Wellington 33% Wellington and Nelson/Tasman/Marlborough residents are more likely than average to be fully prepared. Auckland residents are less likely than average to be fully prepared. Note: Percentages are presented that are statistically higher or lower than the national average at the 95% confidence level. We have not calculated percentages for Canterbury because Christchurch city residents were not interviewed this year.
Preparedness continuum. Bench-mark 2011 2007 2008 2010 2009 Fullyprepared 18% 7% 8% 10% 10% 11% Commitment Have water and survival items 49% 39% 41% 43% 41% 43% Understanding Have a good understanding of theeffects if disaster struck 84% 77% 81% 79% 80% 80%(81%) Awareness Have an understanding of the types of disasters that could occur 82% 83% 82% 82% 81% 79%(80%) Unaware 17% 18% 18% 19% 21%(20%) 18%
How prepared is New Zealand(when at home)? One third are prepared at home. Regularly update emergency survival items Have an emergency survival plan Have emergency items and water • PREPARED AT HOME = 32% • 24% (23%) - 2010 measure • 23% - 2009 measure • 26% - 2008 measure • 24% - 2007 measure • 21% - Benchmark
One third (32%) are prepared at home. Higher than average Auckland 21% Average Below Average Nelson / Tasman / Marlborough 51% Average 32% Wellington 51% Wellington, Nelson/Tasman/Marlborough, and West Coast residents are more likely than average to be prepared at home. Auckland residents are less likely than average to be prepared at home. West Coast 53% Note: Percentages are presented that are statistically higher or lower than the national average at the 95% confidence level. We have not calculated percentages for Canterbury because Christchurch city residents were not interviewed this year.
Most at risk when disaster strikes… • Students: • Less likely to be fully prepared (9%) or committed (30%), and to have understanding (63%) or awareness (62%). • More likely to be unaware (38%). • Those who do not identify as NZ European or Māori: • Less likely to be fully prepared (13%) or committed (40%), and to have understanding (68%) or awareness (71%). • More likely to be unaware (29%). • Those for whom English is not a first language: • Less likely to be fully prepared (11%) or committed (40%), and to have understanding (62%) or awareness (70%). • More likely to be unaware (30%).
The main barriers to being prepared remain similar to previous years, although cost has become a greater barrier over time. • Cost more likely to be a barrier for: • Maori (23%) and Pacific (23%) • Those with a personal income less than $40k per year (22%) • Those with a HH income less than $40k per year (35%) (18%) (24%) (6%) (5%) Q6. You said that being prepared for a disaster is important, but you are not well prepared for one. What stops you from being prepared? Base: Those who stated that being very well/ quite well prepared for a disaster was important but said that they were not well prepared for one: Benchmark (n=341), 2007 (n=387), 2008 (n=398), 2009 (n=431), 2010 (n=417), 2011 (n=383). Note: Statements 2% and below not shown. *Less than .5%
Unprompted awareness of any disaster preparedness advertising. Percentage of NZers who have seen, heard, or read any advertising about preparing for a disaster and the ratecard value of the TV advertising. Fewer New Zealanders recall disaster preparedness advertising this year. *Ratecard value for TV ads (69%) Advertising recall Annual ratecard value ($ million)* • The decrease in recall will be due largely to the fact that the March wave of the quarterly Get Ready Get Thru TV advertising was cancelled following the February earthquake. Q15 Have you seen, heard or read recently any advertising about preparing for a disaster?Base: All Respondents: 2007 (n= 1000), 2008 (n= 1016), 2009 (n=1000), 2010 (n=1000), 2011 (n=1164)
Where seen/heard or read disaster advertising. Those who do recall disaster preparedness advertising are much more likely to mention newspaper advertising (this is likely to be editorial content as no newspaper advertising was carried out this quarter), and slightly more likely to mention radio advertising this year. They are less likely to mention TV advertising. Again, this will be due to the cancellation of the March Get Ready Get Thru TV advertising. Q16 Where did you see, hear or read the ads?Base: Those respondents who stated that they have seen, heard or read advertising about preparing for a disaster, 2007 (n=651), 2008 (n=543), 2009 (n=549), 2010 (n=659), 2011 (n=713). Note: Responses 2% and below not shown.
63% specifically recall the Get Ready Get Thru television advertising. Prompted recall has decreased only marginally since last year, despite the cancellation of the March Get Ready Get Thru advertisements. *Ratecard value for TV ads • Recall lower among: • Those for whom English is not a first language (41%, cf. 67% of others) • Those who identify with an Asian ethnic group (42%, cf. 66% of others) • Those over 60 years of age (50%, cf. 67% who are younger) • Those with a HH income under $40k (54%, cf. 66% of others) Prompted TV advertising recall Annual ratecard value ($ million)* Q18. Have you seen any television advertisements for Civil Defence presented by Peter Elliot? The ads featured emergency services, public transport, and hospitals. The ads show what services may not be there to help you in an emergency and what you need to do to help you survive a disaster. Peter also directs us to the Yellow Pages for further information as well as telling us to go to the “Get Ready, Get Thru” website. Base: All Respondents: 2007 (n= 1000), 2008 (n= 1016), 2009 (n=1000), 2010 (n=1000), 2011 (n=1164)
Diagnostics:The ads are understood, and they’re believable, relevant, helpful, and enjoyable. % agree 98 97 98 99 98 You understood the ad’s message 97 96 96 96 96 The points made were believable (97) 91 92 94 92 89 The points made were relevant 92 92 95 92 94 The information was helpful 81 80 85 79 77 You enjoyed watching the ads 64 53 70 57 58 The ads contained new information 20 16 22 18 20 You are getting fed up seeing them Don’t know Strongly disagree Slightly disagree Slightly agree Strongly agree Q19 Thinking about these adverts for the Ministry of Civil Defence and Emergency Management, please tell me whether you strongly agree, slightly agree, slightly disagree or strongly disagree with each of these statements? Base: Those respondents who stated that they had seen the Civil Defence TV advertising, 2007 (n=631), 2008 (n=418), 2009 (n=608), 2010 (n=654), 2011 (n=710).
In the wake of the September earthquake, the ads were a more effective prompt for putting together a kit, making a plan, and talking to friends and family. 81% who have seen the ads have done something as a result. Q20 What if anything have you done as a result of seeing the ads? Have you… Base: Those respondents who stated that they had seen the Civil Defence TV advertising, 2007 (n=631), 2008 (n=518), 2009 (n=608), 2010 (n=654), 2011 (n=710).
The tagline has become more familiar throughout the campaign. Half of those surveyed (49%) recall the tagline The tagline is particularly familiar to young people aged 15 to 19 (67%), and less familiar to older people aged 50 years or over (33%). Prompted recall of Get Ready Get Thru tagline (47%) Q21. Before I mentioned it earlier, had you previously heard of the tag line “Get Ready, Get Thru”? Base: All Respondents: 2007 (n= 1000), 2008 (n= 1016), 2009 (n=1000) 2010 (n=1000), 2011 (n=1164)
Awareness of the getthru.govt.nz website is maintained at 40%. • Awareness of the website is lower among: • Those who have not taken steps to prepare in the last 12 months (33%, cf. 45% who have) • Those who believe preparedness for a disaster is less than very important (34%, cf. 43% who believe it is very important) • Those who live in small towns or on farms (32%, cf. 43% of others). • Those aged 50 years or over (27%, cf. 47% of those under 50) • Those with a HH income under $40k (34%, cf. 41% of others) • Those who have been living in NZ for 3 years or less (15%, cf. 40% of others) Prompted recall of getthru.govt.nz Q22 And had you also previously heard of the website ‘getthru.govt.nz’? Base: All Respondents: 2007 (n= 1000), 2008 (n= 1016), 2009 (n=1000), 2010 (n=1000), 2011 (n=1164).
Message take-out. Other than ‘be prepared’ the main messages taken from the ads are ‘make sure you have supplies’ and ‘disaster can strike at any time’. (11) (10) (8) (4) (5) Q17. What do you think the ads were trying to tell you? Base: Those respondents who stated that they have seen or heard advertising about preparing for a disaster, 2009 (n=549), 2010 (n=659). Note: Statements 2% and below not shown.
Finding information before a disaster. This year respondents are much more likely to say they can find information at a Civil Defence website. (26) (10) Q12 Before a disaster, where can you get information about how to prepare for a disaster? Base: All Respondents: Benchmark (n= 1001), 2007 (n= 1000), 2008 (n= 1016), 2009 (n=1000), 2010 (n=1000), 2011 (n=1164). Note: The top ten results for 2011 are shown.