Testing Statistical Hypothesis Independent Sample t-Test
Testing Statistical Hypothesis Independent Sample t-Test. Heibatollah Baghi, and Mastee Badii. Research Design. Steps in Test of Hypothesis. Determine the appropriate test Establish the level of significance: α Determine whether to use a one tail or two tail test

Testing Statistical Hypothesis Independent Sample t-Test
E N D
Presentation Transcript
Testing Statistical HypothesisIndependent Sample t-Test Heibatollah Baghi, and Mastee Badii
Steps in Test of Hypothesis • Determine the appropriate test • Establish the level of significance:α • Determine whether to use a one tail or two tail test • Calculate the test statistic • Determine the degree of freedom • Compare computed test statistic against a tabled value
1. Determine the Appropriate Test • If comparing a sample to a population, use one sample tests. • If comparing two samples in order to draw inferences about group differences in the population use two sample t-test. • Here the test statistic is based on a theoretical sampling distribution known as sampling distribution of the difference between two means. Mdiff = • The standard deviation of such a sampling distribution is referred to as the standard error of the difference.
1. Determine the Appropriate Test • Assumptions and Requirements for the two sample test (comparing groups means) are: • Independent variable consists of two levels of a nominal-level variable (when there are two and only two groups). • Dependent variable approximates interval-scale characteristics or higher. • Normal distribution or large enough sample size to assume normality due to the central limit theorem. • Equal variance: assumption of the homogeneity of variance 12 = 12
1. Determine the Appropriate Test • If the two groups are independent of each other uses independent group t-test. • If the two groups are not independent of each other use dependent group t-test also known as paired t-test. This lecture focuses on independent sample t-test which is a parametric test
2. Establish Level of Significance • α is a predetermined value • The convention • α = .05 • α = .01 • α = .001
3. Determine Whether to Use a One or Two Tailed Test • If testing for equality of means then two tailed test • If testing whether one mean greater/smaller than the other then one tailed test
4. Calculating Test Statistics • For the independent groups t-test the formula is: • The numerator is the difference in means between the two samples, and the denominator is the estimated standard error of the difference.
4. Calculating Test Statistics • The estimated standard error of the difference is estimated on the basis of variances of the two samples (Pooled Variance t-test). • Where S21= variance of Group 1 S22 = variance of Group 2 n 1= number of cases in Group 1 n 2= number of cases in Group 2
5. Determine Degrees of Freedom • Degrees of freedom, df, is value indicating the number of independent pieces of information a sample can provide for purposes of statistical inference. • Df = Sample size – Number of parameters estimated • Df is n1 +n2 -2 for two sample test of means because the population variance is estimated from the sample
6. Compare the Computed Test Statistic Against a Tabled Value If |tc| > |tα| Reject H0 If p value < α Reject H0
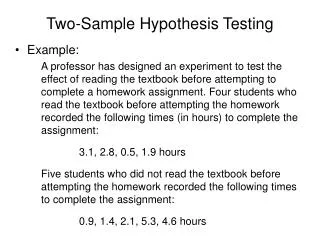
Example of Independent Groups t-tests • Suppose that we plan to conduct a study to alleviate the distress of preschool children who are about to undergo the finger-stick procedure for a hematocrit (Hct) determination. • Note: Hct = % of volume of a blood sample occupied by cells.
Example of Independent Groups t-tests, Continued • Twenty subjects will be used to examine the effectiveness of the special treatment. • 10 subjects randomly assigned to treatment group. • 10 assigned to a control group that receives no special preparation.
1. Determine the Appropriate Test • Testing hypothesis about two independent means (t-test) • Dependent variable = the child’s pulse rate just prior to the finger-stick • Independent variable or grouping variable = treatment conditions (2 levels)
1. Determine the Appropriate Test • Two samples are independent. • Two populations are normally distributed. • The assumption of homogeneity of variance. (Examine Levene’s Test) Ho: 12 = 12 Ha: 12 12 If sig. level or p-value is > .05, the assumption is met.
2. Establish Level of Significance • The convention • α = .05 • α = .01 • α = .001 • In this example, assume α = 0.05
3. Determine Whether to Use a One or Two Tailed Test • H0 : µ1 = µ2 • Ha : µ1 µ2 • Where • µ1 = population mean for the experimental group • µ2 = population mean for the control group
Experimental Group Control Group Rearrange the Data
4. Calculating Test Statistics (continued) Group 1 (Experimental) Group 2 (Control) -------------------------------------------------------------------------------------------------- X1 X2 ------------ --------------
6. Compare the Computed Test Statistic Against a Tabled Value
6. Compare the Computed Test Statistic Against a Tabled Value • If we had chosen a one tail test: • H0 : µ1 = µ2 • Ha : µ1 <µ2 1.73 The null hypothesis can be rejected
Nature & Magnitude of Relationship Going Beyond Test of Significance
rpb (-1.85)2 rpb (-1.85)2 +18 Point Biserial Correlation Measures Strength of the relationship • Point biserial correlation is similar to Pearson r and can be calculated using the same formula or using the following formula:
rpb (-1.85)2 rpb (-1.85)2 +18 Measures of Practical Significance • Point biserial correlation also provides information about the proportion of explained variation in the dependent variable. • In our example 16 % of the variation in the children’s pulse rates is explained by the group membership.
Effect Size • Effect size, gamma () is a measure of the strength of the relationship between two variables in the population and an index of how wrong the null hypothesis is. • The higher the effect size the greater the power of the test.
Effect Size • To evaluate the magnitude of the difference between two means, a mean difference is divided by a “pooled standard deviation.” • Since researches typically do not have the value of the population effect size, it is estimated from sample data.
Most Statistical Tests Assume Randomness • Perfect randomness is often impossible and so researchers try to minimize the different forms of bias in their selection of subjects: • Selection bias • Attrition bias • Non-response bias • Cohort bias
Take Home Lesson How to Compare Mean of Two Independent Samples