Download
1 / 6
70 likes | 100 Vues
Learn how to measure associations and significance between two variables in data analysis. Understand techniques for categorical, ordinal, and interval variables. Discover statistical measures to determine relationship strength and direction.

E N D
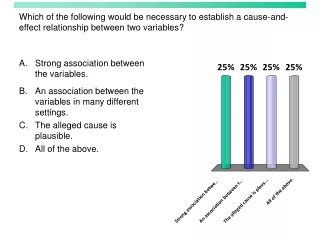
BIVARIATE ANALYSIS: Measures of Association Between Two Variables • Big questions: Does a relationship between two variables exist?: To what extent is a change in the value of one variable associated with the change in the value of another? How consistent is that association? Is any association that we see in our sample due to random chance? • To answer these questions, you must(?) pick the correct measuring technique, depending on the variable • Categorical (nominal), ordinal, and interval variables • Number of response categories and whether you expect a relationship in a specific direction • First question: What is the strength of the relationship? • Coefficients of association • Second question: What is the direction of the relationship? • Positive vs. negative relationships • Reverse code if necessary so that your coding matches your hypothesis
BIVARIATE ANALYSIS (Cont.) Third question: What is the statistical significance of a relationship calculated from a sample? • Review: Statistics versus population parameters • Review: Probability, the normal curve, and sampling error • Sample size and sampling error • The null hypothesis: what is the probability that there is no relationship between our two variables • Significance thresholds: .001, .01, .05, and sometimes with a very small sample: .10 • It is good to have more stars on thars… some examples .15*** vs. .15*
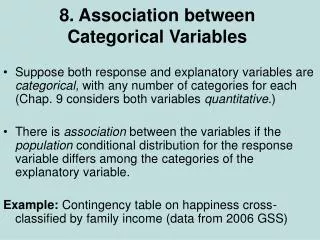
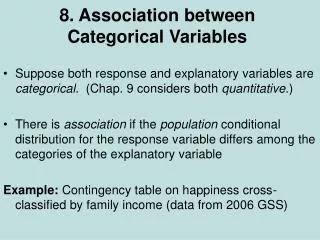
ANALYZING CATEGORICAL (NOMINAL) VARIABLES • We use cross-tabulation (sometimes called a “contingency table”) • Measuring association—What is actually going on in the stats program: • What would be “expect”; “what do we observe” • Measuring the strength of the association • Phi coefficient for a 2x2 table (two dichotomous variables) • Lamda coefficient for other nominal data (or one nominal variable and one ordinal variable) • if Lambda returns a value of .000 and the cross-tab table and X2 test makes it look like that there probably is an association between the two ordinal variables, substitute Cramers V for Lamda. • The most common measure of the statistical significance • X2 (Chi Squared) tests whether or not the row and column variables are independent. • A statistically significant X2 test means that there’s an association • X2 should have at least five cases per cell
ANALYZING ORDINAL VARIABLES • Ordinal means both variables are ordinal, but this can include one dichotomous variable, since they are ordinal in a way (e.g. Republican = 1, else =0 means that those coded 1 are more Republican) • Again, begin with crosstabulation… • Measuring the strength of an association • The method being used: Concordant vs. Discordant pairs • Gamma coefficient is most common measure of association for two ordinal variables (mildly overpredicts) • Somers D(us this when you know the direction of the variables’ relationship) • Is the observed association by chance?Look at the significance statistics
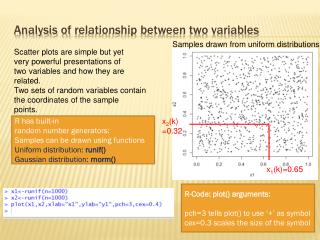
ANALYZING INTERVAL VARIABLES • Assumptions and reality about interval data • Four types of data that often get treated as interval variables: Truly continuous; ratio (zero = lowest); bounded on both ends (e.g., percentage), indexes and scales (e.g., Likert scales) • Acknowledge the limits of the methods in your interpretation of data • Why don’t we use crosstabs and frequency tables to analyze two contentious variables? It’s a mess • What can we use instead?: Scattergrams (ideally we use these to look at the distribution of our data)
ANALYZING INTERVAL VARIABLES • Using ordinary least squares (OLS) regression to “plot” a line • Critical assumption: Linearity and same fit at different levels of the independent variable • Critical OLS Regression and the “best fitting” line • The line enables us to “predict” • Slope of the line reflects axis units • Outliers can dramatically influence the slope • Correlation: • How accurate is our prediction line? • Pearson’s correlation coefficient (R) • Remember (!), correlation does not tell you the slope of the line • The coefficient of correlation (R2)