Download
1 / 7
70 likes | 217 Vues
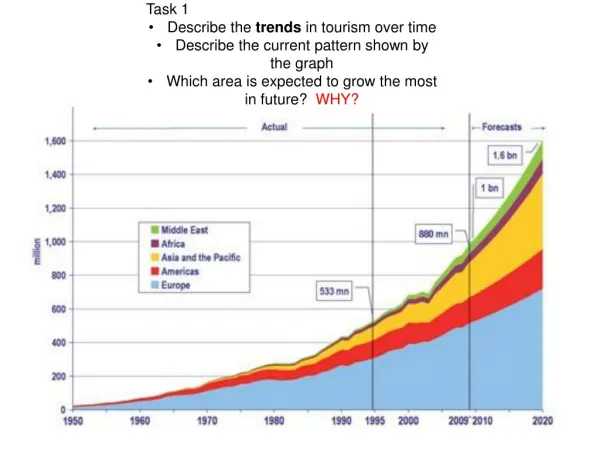
Construct and Describe a Graph Over Time. GRADE 5 Supporting Idea/Big Idea: MA.5.A.4.2: Construct and describe a graph showing continuous data, such as a graph that changes over time Body of Knowledge: Algebra Cognitive Complexity Level: High JULY 13-24 2009

E N D
Construct and Describe a Graph Over Time GRADE 5 Supporting Idea/Big Idea: MA.5.A.4.2: Construct and describe a graph showing continuous data, such as a graph that changes over time Body of Knowledge: Algebra Cognitive Complexity Level: High JULY 13-24 2009 RONNIE KASMIR
Prerequisite Knowledge • Identify information displayed on an object graph or pictographs. • Recognize an object graph or pictograph. • Knowledge of : www.Geogebra.org • Knowledge of : mean, median and mode.
Creating a Chart construct_a_table.ggb
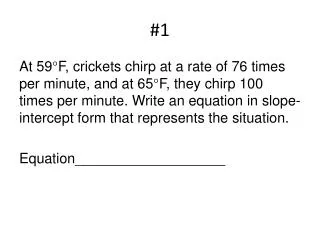
Lisa’s Weekly Tests Scores Create A Line Graph For These Scores. • LINE GRAPH
Other Avenues to Express Data. Create A Graph
QUESTIONS ARE THE ANSWERS • USING QUESTIONING TO STIMULATE MATHEMATICAL THINKING. • QUESTIONS ARE THE ANSWER.mht