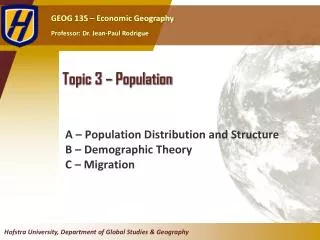
Topic 3 – Population
Topic 3 – Population. A – Population Distribution and Structure B – Demographic Theory C – Migration. A – Population Distribution and Structure. Global Population Distribution Fertility and Mortality Population Structure. 1 . Global Population Distribution.

Topic 3 – Population
E N D
Presentation Transcript
Topic 3 – Population A – Population Distribution and Structure B – Demographic Theory C – Migration
A – Population Distribution and Structure Global Population Distribution Fertility and Mortality Population Structure
1. Global Population Distribution • Evolution of the world’s population • Long historical process: • Has been very slow up to recently. • 300 million people around year 0. • Remained small until the last 250 years. • A new growth trend: • Has increased almost exponentially. • From 1.6 billion in 1900 to 6 billion in 1999. • To what it can be linked? • Population “explosion” • Defines a process of strong demographic growth. • Started after the Second World War. • About 80 million people added each year. • Major concern for the future of humanity.
20 years 15 years 13 years 12 years 13 years 15 years 37 years 118 years World Population 1804-2048 (in billions)
1. Global Population Distribution • Global population distribution • 3.4 billion people were living Asia in 2002. • 21% were Chinese. • Overpopulation • China adds 1 million people per month. • Most of the largest and most crowded cities in the world.
World Population Density and Distribution, 2005 Typical concentrations along major river systems. Areas of large concentrations: South Asia, East Asia, Western Europe, Northeastern North America. “Empty” areas are attributed to: harsh physical landscapes and harsh temperature.
2. Fertility and Mortality • Total Fertility Rate (TFR) • Number of live births per female of reproductive age (15-49). • Indicates population change over a long period of time. • Instructive about societal norms in any given culture. • A TFR of 2.1 is considered as being the replacement birth rate. • Lower than 2.1 yields population decrease while rates greater than 2.1 yields population increase. • Improvements in medical conditions lower the replacement rate (below 2.06 in many countries). 25 females between 15-49 10 children born that year 1,000 60 TFR = 2.04 = (60/1,000) * (49-15)
Total Fertility Rate, Selected Countries, 1995-2010 Replacement rate (2.1)
2. Fertility and Mortality • Causes of death • Throughout most of history famine, epidemics, and wars have been the leading causes of death. • Primary causes of death began to shift to degenerative problems related to aging. • These include such factors as heart disease and cancer. • Death and welfare • Used to be considered a sign of the health of a population. • Different age structures among the populations of different countries. • Possible for a nation with high living standards to have a higher death rate than a poorer nation. • Reason: overall older population.
2. Fertility and Mortality • Life expectancy • Number of years a person is expected to live. • Based on current death rates. • Does not necessarily apply to current generation. • May change due to ameliorations in standards of living. • Context • Strong geographical variations in life expectancy. • Half a century ago, most people died before the age of 50. • Global average life expectancy reached 66 years in 2006. • Several achievements and failures: • Economic development has benefited human health. • Improvement in diet and sanitation. • Urbanization may have adverse effects.
2. Fertility and Mortality • Factors behind higher life expectancy • About 40 years was gained in the 20th century. • 90% of the reduction in the death rate occurred before the introduction of antibiotics or vaccines. • Major factors (33 years): • Improved sanitation (for food and water). • Reduction in crowding. • Central heating. • Sewer systems. • Refrigeration. • Improved health (7 years): • Mainly medical technology. • Small share attributed to drugs.
What Difference a Century Makes: Life Expectancy at Birth, 1910 and 1998
2. Fertility and Mortality • Optimum life expectancy • Life expectancy is ultimately dictated by human physiology: • At some points, organs cease to function properly. • Limit on the lifespan of non-cancerous human cells. • Nearing life expectancy limits: • Even if age-related diseases such cancer, heart disease, and stroke were eradicated, life expectancy would only increase by 15 years. • Currently around 77 years. • Expected to reach 85 years in most developed countries by 2030.
Age group 10 0 10 Percentage of the population 3. Population Structure • Population Pyramid • Graph showing the breakdown of each sex by age group (cohort). • Illustrates a nation’s population structure. • Shows the male/female composition of the population. • Most of the time, the breakdown involves 5 years periods. 75+ 60-75 Males Females 45-60 30-45 15-30 0-15
B – Demographic Theory The Malthusian Trap Demographic Transition Theory
1. The Malthusian Trap Subsistence Economy New Technology Return to Subsistence Populations growth, pressures on resources less births and more deaths Equilibrium (Births = Deaths) Higher incomes, higher births andlower deaths Death Rate Births Birth Rate Deaths SubsistenceIncome SubsistenceIncome Low Income SubsistenceIncome Low Income Low Income High Income High Income High Income
1. The Malthusian Trap • The “Malthusian crisis” • Available agricultural land is limited. • Technical progresses (machinery, irrigation, fertilizers, and new types of crops) are slow to occur. • Increasing incapability to support population. • If this persists, the population will eventually surpass available resources. • The outcomes are “Malthusian crises”: • Food shortages. • Famines. • War and epidemics. • “Fix” the population in accordance with available resources. • Necessity of a “moral restraint” on reproduction.
t3 t2 Technological Innovation t1 Resources Population 1. The Malthusian Trap Quantity Overexploitation Time
1. The Malthusian Trap • The Malthusian Crisis has not occurred • Malthus has been criticized on several accounts during the last 200 years. • Religious view (Protestantism), racist and elitist. • Did not foresee the demographic transition: • Changes in the economy that changed the role of children in industrializing societies. • Declining birth rates; population growth no longer exponential. • Failed to account for improvements in technology: • Enabled food production to increase at rates greater than arithmetic, often at rates exceeding those of population growth. • Enabled to access larger amounts of resources. • Enabled forms of contraception.
1. The Malthusian Trap • Creative pressure • Opposed to the Malthusian perspective. • Often labeled as the economic optimistic view. • Brought forward in the early 1960s. • Population has a positive impact on economic growth. • Resources limited by humanity’s potential to invent. • “Necessity is the mother of all inventions”. • Scarcity and degradation are the sign of market failures. • Population pressure forces the finding of solutions. Demographic growth Problem Higher occupation densities ? Pressures to increase productivity Solution Innovations Outcome Productivity growth
1. The Malthusian Trap • Technological innovation and agriculture • Intensification of agriculture. • New methods of fertilization. • Pesticide use. • Irrigation. • Multi-cropping systems in which more than one crop would be realized per year. • Creative pressure and global population growth • Would lead to new productivity gains. • Humans don’t deplete resources but, through technology, create them. • Resources will become more abundant. • Help overcome shortage in food production and employment.
1. The Malthusian Trap • Limits of food production by environmental factors • Substitution is not possible for many resources. • Soil exhaustion and erosion. • Evolutionary factors such as the development of greater resistance to pesticides. • Climate change. • Loss of productive soils due to land use conversion to other purposes, such as urbanization. • Water shortages and pollution. • Limits by technology • May be available but not shared. • Maybe too expensive for some regions (e.g. desalination).
Global Population (1950-2010) and Growth Scenarios, 2010-2050
Metropolitan Areas of More than 10 Million Inhabitants, 2010
Major Phases of Demographic Change • Agricultural Revolution • Feudal society. • Wealth from agriculture and land ownership. • Slow demographic growth. • Industrial Revolution • Wage labor society. • Wealth from industry and capital ownership. • Fast demographic growth. • Post-Industrial Revolution • Information society. • Wealth from technological development. • Slow demographic growth. Agricultural Revolution 12,000 years Industrial Revolution 200 years Post-Industrial Revolution
C – Migration Causes of Migration Patterns of Migration
1. Causes of Migration • Context • Migrations as the response of individual decision-makers. • Negative or push factors in his current area of residence: • Positive or pull factors in the potential destination • Intervening obstacles. • The problem of perception • Assumes rational behavior on the part of the migrant: • Not necessarily true since a migrant cannot be truly informed. • The key word is perception of the pull factors. • Information is never complete. • Decisions are made based upon perceptions of reality at the destination relative to the known reality at the source. • When the migrant’s information is highly inaccurate, a return migration may be one possible outcome.
1. Causes of Migration • Labor mobility • The primary issue behind migration. • Notably the case at the national level. • Equilibrate the geographical differences in labor supply and demand. • Accelerated with the globalization of the economy. • Remittances • Capital sent by workers working abroad to their family / relatives at home. • $276 billion in 2006 ($85 billion in 2000): • $16 billion each year goes out of Saudi Arabia as remittances. • 2nd most important most important source of income for Mexico (after oil and before tourism); $25 billion in 2006. • Now higher than official aid. Labor shortages High wages Migration Surplus labor Low wages
2. Patterns of Migration • Growing level of temporary migration schemes • Work permits. • More in tune with seasonal and economic cycles. • Skilled migrants are increasingly sought after • Lower costs. • Cannot be easily recruited by another corporation. • Growing anti-immigration stance in many countries • Health: carry endemic diseases. • Economic: depress wages and increase social burden. • Nationalism: undermine the cohesion of nation-states. • Environment: cause additional population burdens.