Download
1 / 9
90 likes | 198 Vues
This overview explores congestion metrics in transmission system studies, focusing on nodal and shadow prices, historical analysis, types of congestion, and limitations on interpretation. Learn about simulated flows, nodal pricing, and DOE studies.

E N D
Congestion Metrics Background Wally Gibson, NWPCC TAS Meeting - Portland February 20, 2008
Overview • Goal of studies: indication of value of expanding transmission system • Kinds of congestion • Historical analysis • What the TEPPC studies produce • Simulated flows • High levels without constraint binding indicate potential congestion • Nodal and Shadow prices • Nodal and shadow prices • Limitations on interpretation • What DOE used last time
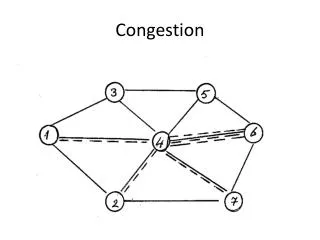
Kinds of Congestion • Excess: • Requests for transmission service • Requests to schedule • Real time flow • TEPPC studies show (as congestion) something like a mix of the last two • Potential flow from economic dispatch exceeding path constraints • Shown by differential nodal prices and associated non-zero shadow prices on path constraints
Historical Analysis • Historical flow analysis: flow vs. OTC • Useful for benchmarking simulated flows • Useful for highlighting high usage paths • Western usage limits schedules and flows to OTC • Limited flow does not clearly demonstrate lack of demand • Future analysis of ATC and schedule data by HAWG will illuminate this issue
Nodal and Shadow Prices • Change in value of total production cost for one unit (MW) change in value of constraint • Nodal prices: from change in load or generation level • Shadow prices: from change in level of path constraint • Load nodal prices typically affected by multiple generation changes in constrained system • Limitations: • Cannot extrapolate to large changes in constraint value • Cannot assume values of nodal/shadow prices are additive • Changing one constraint could change multiple prices
Congestion Metrics Using Nodal and Shadow Prices – Congestion Rent • Index based on multiplying path shadow price by total flow or path limit • Pros: Easy, some models produce automatically, distinguishes between effect on large and small lines • Cons: Doesn’t answer question (with exception), extrapolates beyond range of shadow price • Exception: • In full nodal pricing framework (CAISO), congestion rent is useful metric • Not applicable in rest of West
Congestion Metrics Using Nodal and Shadow Prices – Added Flow Calculation • Index based on multiplying shadow price by additional flow from unconstrained case • In SSG-WI modeling, unconstrained case was problematic due to loss treatment (generic losses added to loads) • In Promod, the problem may be less severe • Does not address issue of extrapolating shadow prices outside of their range • A version of this is the right answer for any specific path • Looking at change in total production cost for specific increase in an individual path size
Congestion Metrics Using Nodal and Shadow Prices – Simple Inspection • Looking only at high shadow prices suggests potential high value • Looking a large path size suggests potential high value, especially if coupled with high shadow price • Can only be confirmed with further study, and should not be directly used for broader purposes
What Did DOE Do in Last Study? • In 2006 Congestion Report, DOE looked at: • For West as a whole: • Primarily, historical path flow information • Secondarily, an unspecified approach that ranked based on usage and economic (shadow price) information • For individual congestion category designations in West: • Other reports than the SSG-WI report