Download
1 / 22
220 likes | 310 Vues
Explore how government policies like price supports, import quotas, and tariffs create market distortions, causing losses to consumers and unintended consequences for producers. Understand the implications on economy and society.

E N D
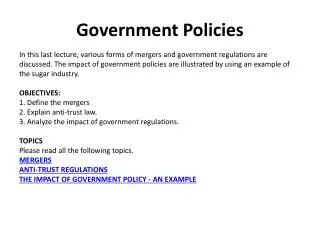
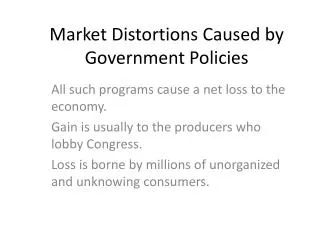
Market Distortions Caused by Government Policies All such programs cause a net loss to the economy. Gain is usually to the producers who lobby Congress. Loss is borne by millions of unorganized and unknowing consumers.
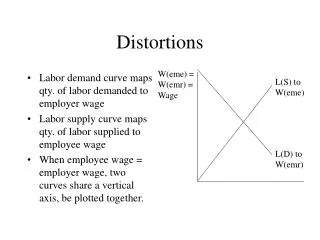
S’ S PS D P0 C D Q1 Q0 Supply Restrictions: General Analysis Price A B • CS reduced by A + B Cost to government = B + C + D = additional profit made if producing Q0 at PS • Change in PS • = A + B + D Quantity
S Pmin P0 C D D Q3 Q0 Q2 Minimum Prices: Sound Good to Producers But Do Not Work Well Price If producers produce Q2, the amount Q2 - Q3 will go unsold. B A D measures total cost of increased production not sold The change in producer surplus will be A - C - D. Producers may be worse off. Quantity
Price Supports • Much of agricultural policy is based on a system of price supports. • Price set by government above free-market level and maintained by governmental purchases of excess supply • Government can also increase prices through restricting production, directly or through incentives to producers
Price Supports • What are the impacts on consumers, producers and the federal budget? • Consumers • Quantity demanded falls and quantity supplied increases • Government buys surplus • Consumers must pay higher price for the good • Loss in consumer surplus equal to A+B
Price Supports • Producers • Gain since they are selling more at a higher price • Producer surplus increases by A+B+D • Government • Cost of buying the surplus which is funded by taxes so indirect cost on consumers • Cost to government = (Q2-Q1)PS
S Qg Ps D P0 D + Qg E D Q1 Q0 Q2 Price Supports Price To maintain a price Ps the government buys quantity Qg . A B Net Loss to society is E + B Quantity
Price Supports • Government may be able to “dump” some of the goods in the foreign markets • Total welfare effect of policy CS + PS – Govt. cost = D – (Q2-Q1)PS • Society is worse off over all • Less costly to simply give farmers the money
S Qg P0 = $3.70 C A B P0 = $3.46 D + Qg D 1,800 2,566 2,630 2,688 Example: The Wheat Market in 1981 Price • AB consumer loss • ABC producer gain By buying 122 million bushels the government increased the market-clearing price. Quantity
Supporting the Price of Wheat • In 1985, the situation became worse • Export demand fell and the market clearing price of wheat fell to $1.80/bushel. • Equilibrium quantity was 2231 • The actual price, however, was $3.20 • To keep price at $3.20, the government had to purchase excess wheat • Government also imposed a production quota of about 2425 million bushels
Supporting the Price of Wheat • 1985 Government Purchase: • 2,425 = 2,580 - 194P + QG • QG = -155 + 194P • P = $3.20 -- the support price • QG = -155 + 194($3.20) = 466 million bushels
QS S’ S P0 = $3.20 P0 = $1.80 D + QS D 1,800 1,959 2,232 2,425 Quantity The Wheat Market in 1985 Price To increase the price to $3.20, the government bought 466 million bushels and imposed a production quota of 2,425 bushels.
Supporting the Price of Wheat • 1985 Government Cost: • Purchase of Wheat = $3.20 x 466 = $1,491 million • 80 cent subsidy = .80 x 2,425 = $1,940 million • Total government program cost = $3.5 billion
Import Quotas and Tariffs • Many countries use import quotas and tariffs to keep the domestic price of a product above world levels • Import quotas: Limit on the quantity of a good that can be imported • Tariff: Tax on an imported good • This allows domestic producers to enjoy higher profits • Costs to consumers is high
Import Quotas and Tariffs • With lower world price, domestic consumers have incentive to purchase from abroad. • Domestic price falls to world price and imports equal difference between quantity supplied and quantity demanded • Domestic industry might convince government to protect industry by eliminating imports • Quota of zero or high tariff
S P0 A B C PW Imports D QS Q0 QD Import Tariff To Eliminate Imports Price In a free market, the domestic price equals the world price PW. Quota of zero pushes domestic price to P0 and imports go to zero. Loss to consumers is A+B+C. Gain to producers is A. Dead weight loss: B +C. Quantity
The increase in price can be achieved by a tariff. QS increases and QD decreases Area A is the gain to domestic producers. The loss to consumers is A + B + C + D. DWL = B + C Government Revenue is D = tariff * imports S P P* B D C A Pw D Q QS Q’S Q’D QD Import Tariff (general case)
If a quota is used, rectangle D becomes part of the profits to foreign producers Consumers lose A+B+C+D Producers gain A Net domestic loss is B + C + D. S P P* B D C A Pw D Q QS Q’S Q’D QD Import Quota (general case)
The Sugar Quota Example • The world price of sugar has been as low as 4 cents per pound, while in the U.S. the price has been 20-25 cents per pound. • Sugar quotas have protected the sugar industry but driven up prices • Domestic producers have been better off and so have some foreign producers that have quota rights • Consumers are worse off
The Sugar Quota Example • The Impact of a Sugar Quota in 2001 • U.S. production = 17.4 billion pounds • U.S. consumption = 20.4 billion pounds • U.S. price = 21.5 cents/pound • World price = 8.3 cents/pound • Price elasticity of US supply = 1.5 • Price elasticity of Us demand is –0.3
Impact of Sugar Quota • The data can be used to fit the US supply and demand curves • QS = -8.70+ 1.21P • QD = 26.53 - 0.29P • World price was 24.2 million pounds leading to little domestic supply and most domestic consumption coming from large imports • Government restricted imports to 3 billion pounds raising price to 21.5 cents/pound
DUS SUS Price (cents/lb.) PUS = 21.5 after quota 20 A 16 11 PW = 8.3 before quota 8 4 Quantity (billions of pounds) 1.4 17.4 20.4 24.2 Sugar Quota in 1997 B C D The cost of the quotas to consumers was A + B + C + D = $2.4b. The gain to producers was area A = $1b.