Download
1 / 1
10 likes | 101 Vues
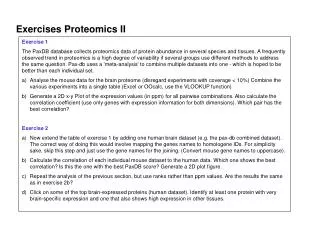
Explore PaxDB database for mouse brain proteome data analysis, compare correlations between mouse datasets and human brain data, plot 2D figures, and identify brain-specific and multi-tissue proteins.

E N D
ExercisesProteomics II Exercise 1 The PaxDBdatabasecollectsproteomicsdataofproteinabundance in severalspeciesandtissues. Afrequentlyobservedtrend in proteomicsis a highdegreeofvariabilityifseveralgroupsuse different methodstoaddressthe same question. Pax-dbuses a 'meta-analysis' tocombine multiple datasetsintoone - whichishopedtobebetterthaneach individual set. Analyse themousedataforthebrainproteome (disregardexperimentswithcoverage < 10%) Combine thevariousexperimentsinto a singletable (Excel orOOcalc, usethe VLOOKUP function) Generate a 2D x-y Plot oftheexpressionvalues (in ppm) for all pairwisecombinations. Also calculatethecorrelationcoefficient (useonly genes withexpressioninformationforbothdimensions). Which pair hasthebestcorrelation? Exercise2 Nowextendthetableofexercise 1 byaddingone human braindataset(e.g. thepax-dbcombineddataset). The correctwayofdoingthiswouldinvolvemappingthe genes namestohomologene IDs. Forsimplicitysake, skipthisstepand just usethegenenamesforthejoining. (Convertmousegenenamestouppercase). Calculatethecorrelationofeach individual mousedatasettothe human data. Whichoneshowsthebestcorrelation? Is thistheonewiththebestPaxDB score? Generate a 2D plotfigure. Repeat theanalysisoftheprevioussection, but useranksratherthan ppm values. Are theresultsthe same as in exercise 2b? Click on someofthe top brain-expressedproteins (human dataset). Identifyat least oneproteinwithverybrain-specificexpressionandonethat also showshighexpression in othertissues.