Understanding the Ascending Triangle Pattern in Technical Analysis
An Ascending Triangle is a bullish chart pattern where the price hits the same resistance level while the lows keep getting higher. It shows buyers are gaining strength. A breakout above the top line usually signals a potential upward move.


Understanding the Ascending Triangle Pattern in Technical Analysis
E N D
Presentation Transcript
Understanding the Ascending Triangle Pattern in Technical Analysis For more visit: https://navia.co.in/blog/ascending-triangle-pattern-in-technical-analysis//
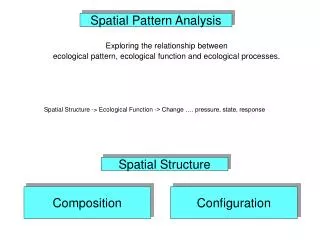
Ascending Triangle Pattern Definition: A bullish continuation pattern indicating potential upward breakout. Formation: Characterized by a horizontal resistance line and an upward-sloping support line, forming a triangle. Significance: Suggests increasing buying pressure as higher lows are formed, leading to a breakout above resistance. For more visit: https://navia.co.in/blog/ascending-triangle-pattern-in-technical-analysis//
Key Characteristics • Horizontal Resistance: Price repeatedly hits a flat resistance level without breaking through. • Upward-Sloping Support: Price forms higher lows, indicating aggressive buying. • Converging Trendlines: The resistance and support lines converge, forming the triangle shape. • Volume Pattern: Volume typically decreases during consolidation and spikes upon breakout. For more visit: https://navia.co.in/blog/ascending-triangle-pattern-in-technical-analysis//
Identifying the Pattern • Spot Horizontal Resistance: Look for a level where price consistently fails to rise above. • Identify Upward-Sloping Support: Ensure price forms higher lows over time. • Await Breakout: Confirmation occurs when price breaks above resistance with increased volume. • Measure Height: Calculate the distance between resistance and the lowest support point to project target price. For more visit: https://navia.co.in/blog/ascending-triangle-pattern-in-technical-analysis//
Trading Strategy • Entry Point: Enter a long position upon breakout above resistance with significant volume. • Stop-Loss: Place just below the upward-sloping support line or recent swing low. • Target Price: Add the height of the triangle to the breakout point to estimate potential gain. For more visit: https://navia.co.in/blog/ascending-triangle-pattern-in-technical-analysis//
Disclaimer Investment in securities market are subject to market risks, read all the related documents carefully before investing. The securities quoted are for illustrative purposes and are not intended as recommendations. Brokerage will not exceed the SEBI prescribed limit. Navia Markets Ltd ,SEBI Registration No.INZ000095034-NSE Member code for CM, FAO & CD: 07708 - BSE Clearing No. for CM, FAO & CD: 6341-MCX Member ID: 45345 NSDL DP ID: IN300378-CDSL DP ID: 12086500-SEBI Registration No. for DP: IN-DP-311-2017-GST Registration number :33AAACM4739R2ZZ-Registered office: Ganga Griha, 4th & 5th Floor, No.9, Nungambakkam High Road, Chennai - 600 034 Email ID: ig@navia.co.in - Contact No: +91 70100 75500 https://bit.ly/naviadisclaimer For more visit: https://navia.co.in/blog/ascending-triangle-pattern-in-technical-analysis//