Download
1 / 5
50 likes | 76 Vues
The morphology of WO3 is studied by AFM microscopy in order to specify the roughness which usually controls the movement of a free electron between the different layers which is fabricated the sensor. Additionally, STM microscopy gives the electrical characteristics of the sample by (STS) in a nanoscopic scale. As well as the electronic cloud which is located in the middle distance between atoms and resulted by insertion of their electrons.

E N D
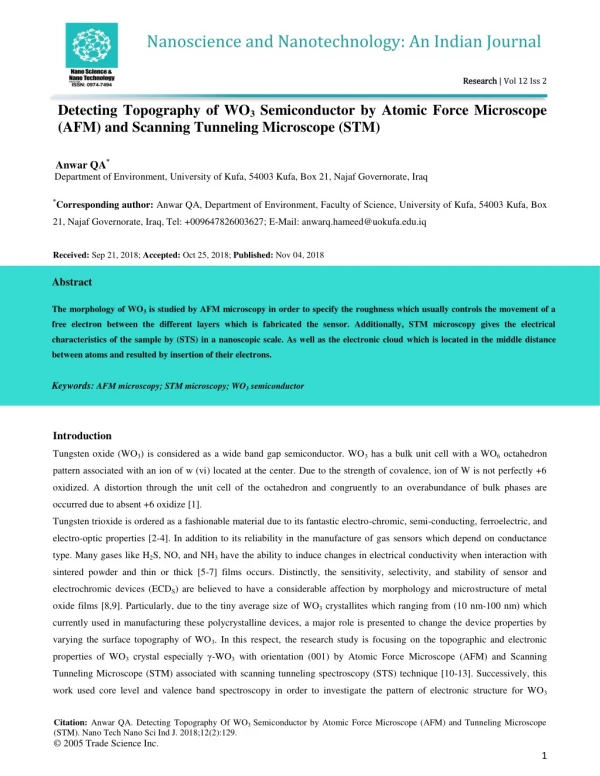
Nanoscience and Nanotechnology: An Indian Journal Analytical Chemistry: An Indian Journal Research Research | Vol 12 Iss 2 Research Research | Vol 1 Iss 1 Detecting Topography of WO3 Semiconductor by Atomic Force Microscope (AFM) and Scanning Tunneling Microscope (STM) Anwar QA* Department of Environment, University of Kufa, 54003 Kufa, Box 21, Najaf Governorate, Iraq *Corresponding author: Anwar QA, Department of Environment, Faculty of Science, University of Kufa,54003 Kufa, Box 21, Najaf Governorate, Iraq, Tel: +009647826003627; E-Mail: anwarq.hameed@uokufa.edu.iq Received: Sep 21, 2018; Accepted: Oct 25, 2018; Published: Nov 04, 2018 Abstract The morphology of WO3 is studied by AFM microscopy in order to specify the roughness which usually controls the movement of a free electron between the different layers which is fabricated the sensor. Additionally, STM microscopy gives the electrical characteristics of the sample by (STS) in a nanoscopic scale. As well as the electronic cloud which is located in the middle distance between atoms and resulted by insertion of their electrons. Keywords: AFM microscopy; STM microscopy; WO3 semiconductor Introduction Tungsten oxide (WO3) is considered as a wide band gap semiconductor. WO3 has a bulk unit cell with a WO6 octahedron pattern associated with an ion of w (vi) located at the center. Due to the strength of covalence, ion of W is not perfectly +6 oxidized. A distortion through the unit cell of the octahedron and congruently to an overabundance of bulk phases are occurred due to absent +6 oxidize [1]. Tungsten trioxide is ordered as a fashionable material due to its fantastic electro-chromic, semi-conducting, ferroelectric, and electro-optic properties [2-4]. In addition to its reliability in the manufacture of gas sensors which depend on conductance type. Many gases like H2S, NO, and NH3 have the ability to induce changes in electrical conductivity when interaction with sintered powder and thin or thick [5-7] films occurs. Distinctly, the sensitivity, selectivity, and stability of sensor and electrochromic devices (ECDS) are believed to have a considerable affection by morphology and microstructure of metal oxide films [8,9]. Particularly, due to the tiny average size of WO3 crystallites which ranging from (10 nm-100 nm) which currently used in manufacturing these polycrystalline devices, a major role is presented to change the device properties by varying the surface topography of WO3. In this respect, the research study is focusing on the topographic and electronic properties of WO3crystal especially γ-WO3 with orientation (001) by Atomic Force Microscope (AFM) and Scanning Tunneling Microscope (STM) associated with scanning tunneling spectroscopy (STS) technique [10-13]. Successively, this work used core level and valence band spectroscopy in order to investigate the pattern of electronic structure for WO3 Citation: Anwar QA. Detecting Topography Of WO3 Semiconductor by Atomic Force Microscope (AFM) and Tunneling Microscope (STM). Nano Tech Nano Sci Ind J. 2018;12(2):129. © 2005 Trade Science Inc. 1
www.tsijournals.com | October-2018 crystallite with STS technique. Nevertheless, just with STS technique, a local probe can be addressed into the surface of WO3 crystallite and crystallite-crystallite boundaries to get an investigation about the local electronic properties associated to the topography identified by STM and AFM as well. This determined and considered through this work to clarify WO3 advantages over another semiconductor. Preparation WO3 Nanostructure Tungsten trioxide nanostructure (WO3) synthesized by using pyrolysis method for a precursor of W(CO)6 in an acid with high temperature (around 220℃). Metallic (W) nanoparticles were spin coated on a glass substrate under atmospheric conditions. By the heat treatment, WO3 structure is translated to WO3 phase at high temperature (530℃). The Density of State (DOS) The total density of state (DOS) is projected by O 2p and W 5d in the state of WO3 semiconductor. Hence, O 2p states are dominated the valence band of crystal while the conduction band dominated with W 5d states. Moreover, it appears a considerable hybridization by this study between valence and conduction bands. WO3 in STM Scanning with 56.6 nm of Resolution Term (STS) is defined as the scanning tunneling spectroscopy, which shows the signal of (STM) upon the local electronic structure of the surface. The (STM) measurement shows the density of state of the electron cloud for the WO3 sample. Chart 1 shows the tunneling current value is increased exponentially with the positive voltage applied and that proves the (WO3) is N-type semiconductor because the electrons tunnel from full tip states to empty conduction band states in the WO3 sample as presented the positive part of the voltage in the chart. Furthermore, the absence of electrons tunneling from the sample to the tip when a negative voltage is applied due to its need to higher negative voltage as revealed in straightening voltage line. The work function for (WO3) is around (4.5 eV) and the reason which makes us could not identify it related to the absence of the negative voltage part versus negative current part i.e. it did not apply enough negative voltage. CHART 1. Shows the voltage and current which applied between the tip and the sample. The STM image of constant height mode, which was used in this work, gives the electrical characteristics of the sample by (STS) in nanoscopic scale, i.e. the variant which occurs in the tunneling current value across the sample surface. That does not necessarily match to the site of the atoms of the lattice (nuclei). However, a high peak value of tunneling current in the STM image is observed in a specific location for the tungsten oxide (WO3) sample. This peak is matched to the higher electron density [14]. That resulted from the atomic cloud for each neighbor atom is inserted at the middle distance between 2
www.tsijournals.com | October-2018 them. This lead to a cloud of electrons, which cause an increment in the tunneling current when the tip is scanned sample as shown in FIG. 1. That peak means there is increment happened in the electrons transition between tip and sample [15]. FIG. 1. A schematic of tungsten oxide, the electron cloud which appears a peak in current as a result of tunneling increment. The presence of dispersion lines or blurred figure in the (STM) scanning which appeared is due to existence of contamination molecules with a diameter larger than the distance that separated the tip and surface of (WO3) sample that remain draft by the tip across the surface because the distance between the tip and sample is smaller than the diameter of contamination molecules [16]. Therefore, these molecules attached to the tip of the (STM) probing during its movement and scraping the surface of (WO3) when they move together. However, if the scanning process of (STM) which is achieved with vacuum, the image will appear with a higher resolution due to the absent of harness molecules [17]. WO3 with AFM Scanning with 25 μm of Resolution The cross-section is larger in (AFM) state compared with (STM) and that caused a less resolution of imaging in (AFM) probing, (25 µm, and 56.6 nm) respectively as described in FIG. 2 with a constant (P-Gain) as stated on (2000). Moreover, these resolution values are identified for AFM with microscale and nanoscale for STM depending on many experiments that achieved in the laboratory to get on the highest resolution which limited by instruments (AFM and STM systems) and sample characteristics. FIG. 2. Shows the difference between the (AFM) and (STM) scanning for Tungsten oxide WO3 sample. However, FIG. 3 demonstrate the roughness or like hills for WO3 sample which ranging to (0.54 μm). Moreover, the topography of the surface has a crystalline state pattern instead of amorphous as clarified in FIG. 3 due to annealing treatment and that lead to reducing, electrochromic performance such as current density and coloration efficiency [18]. 3
www.tsijournals.com | October-2018 FIG. 3. Shows the morphology for the surface of the prepared sample with annealing. However, the gas sensor is a surface dominating process, whereas a sensing layer is a rough and porous microstructure in a special pattern, it will have the advantage to enhance response characteristics of active adsorption sites of the sensor surface for the analyte gas molecules like NO2. That is related to increase the surface area of interaction for the sensor as more roughness is increased. Practically, this is applied by dosing WO3 as nanoclusters into the substrate of sensors surface which is manufactured from semiconductor like SnO2. Therefore, the response time and recovery time for interaction with the analyte gas molecules will be decreased by activating the mechanism of adsorption and desorption for the analyte gas molecules on the sensor surface [19]. However, the efforts focus on improving the efficiency of sensors by reducing their resistance which is achieved by dosing WO3 onto the surface of the SnO2 thin film. That will lead to capture oxygen molecules of SnO2 thin filminto the WO3 due to the high affinity of tungsten as compared to tin. Therefore, as more oxygen is captured by WO3, oxygen vacancies are more created in the SnO2 thin film. Consequently, more and more free electrons on the surface of the SnO2 thin film will be generated and lead to lower resistance. Conclusion As WO3 is dispersed on SnO2 thin film, a change will happen in their electrical properties and that increases the number of free electrons on the surface of the SnO2 thin film. However, the roughness of the surface of WO3 will be the main parameter to control these changes. Moreover, thickness has the effect that is no less important as compared to roughness. REFERENCES 1. Najafi-Ashtiani H, Bahari A, Ghasemi S. A dual electrochromic film based on nanocomposite of the copolymer and WO3 nanoparticles: Enhanced electrochromic coloration efficiency and switching response. J Electro Chem. 2016;774:14-21. 2. Dastan D, Panahi SL, Chaure NB. Characterization of titania thin films grown by dip-coating technique. J Mater Sci Mater Electro. 2016;27(12):12291-6. 3. Ren Y, Gao Y, Zhao G. Facile single-step fabrications of electrochromic WO3 micro-patterned films using the novel photosensitive sol-gel method. Ceram Int. 2015;41(1):403-8. 4
www.tsijournals.com | October-2018 4. Granqvist CG, Niklasson GA, Azens A. Electrochromics: fundamentals and energy-related applications of oxide-based devices. Appl Phys A. 2007;89(1):29-35. 5. Li H, Lv Y, Zhang X, et al. High-performance ITO-free electrochromic films based on bi-functional stacked WO3/Ag/WO3 structures. Sol Energy Mater Sol Cells. 2015;136:86-91. 6. Buch VR, Chawla AK, Rawal SK. Review of the electrochromic property for WO3 thin films using different deposition techniques. Mater Today Proceedings. 2016;3(6):1429-37. 7. Park SI, Kim S, Choi JO, et al. Low-cost fabrication of WO3 films using a room temperature and low-vacuum air-spray based deposition system for inorganic electrochromic device applications. Thin Solid Films. 2015;589:412-8. 8. Park KW. Electrochromic properties of Au-WO3 nanocomposite thin-film electrode. Electrochimica acta. 2005;50(24):4690-3. 9. Gondal MA, Suliman MA, Dastageer MA, et al. Visible light photocatalytic degradation of herbicide (Atrazine) using surface plasmon resonance induced in the mesoporous Ag-WO3/SBA-15 composite. J Mol Catal A Chem. 2016;425:208-16. 10. Hoseinzadeh S, Ghasemiasl R, Bahari A, et al. The injection of Ag nanoparticles on the surface of the WO3 thin film: enhanced electrochromic coloration efficiency and switching response. J Mater Sci Mater Electro. 2017;28(19):14855-63. 11. Shimanoe K, Nishiyama A, Yuasa M, et al. Microstructure control of WO3 film by adding nano-particles of SnO2 for NO2 detection in ppb level. Procedia Chem. 2009;1(1):212-5. 12. Kaur J, Roy SC, Bhatnagar MC. Highly sensitive SnO2 thin film NO2 gas sensor operating at low temperature. Sens Actuators B Chem. 2007;123(2):1090-5. 13. Sharma A, Tomar M, Gupta V. Low temperature operating SnO2 thin film sensor loaded with WO3 micro-discs with the enhanced response for NO2 gas. Sens Actuators B Chem. 2012;161(1):1114-8. 14. Zhang C, Debliquy M, Boudiba A, et al. Sensing properties of atmospheric plasma-sprayed WO3 coating for sub-ppm NO2 detection. Sens Actuators B Chem. 2010;144(1):280-8. 15. Teoh LG, Hon YM, Shieh J, et al. Sensitivity properties of a novel NO2 gas sensor based on the mesoporous WO3 thin film. Sens Actuators B Chem. 2003;96:219-25. 16. Andrei EY, Li G, Du X. Electronic properties of graphene: a perspective from scanning tunneling microscopy and magneto-transport. Rep Prog Phys. 2012;75(5):056501. 17. Soutter W. Tungsten Oxide (WO3) Nanoparticles-Properties, Applications. 2014. 18. Granqvist CG. Electrochromic tungsten oxide films: a review of progress 1993-1998. Sol Energy Mater Sol Cells. 2000;60(3):201-62. 19. Gao W, Alemany LB, Ci L, Ajayan PM. New insights into the structure and reduction of graphite oxide. Nat Chem. 2009;1(5):403-8. 5


![Force [N/m]](https://cdn2.slideserve.com/4557374/slide1-dt.jpg)