Download
1 / 8
80 likes | 99 Vues
A high-performance thin layer chromatographic method for determination of Teneligliptin was developed and validation as per ICH<br>guidelines. HPTLC separation was performed on aluminum plates precoated with silica gel 60F254 and Methanol: Toluene:<br>Triethylamine (1:3:1% v/v) as optimized mobile phase at detection wavelength of 245 nm. The retardation factor (Rf) value for<br>Teneligliptin were 0.63 respectively. Accuracy for the marketed formulation teneza was found to be 98.31-100.51%.The percent relative<br>standard deviation for repeatability and intermediate precision studies was found to be < 2%. The propose development HPTLC method<br>can be applied for identification and quantitative determination of Teneligliptin.<br>

E N D
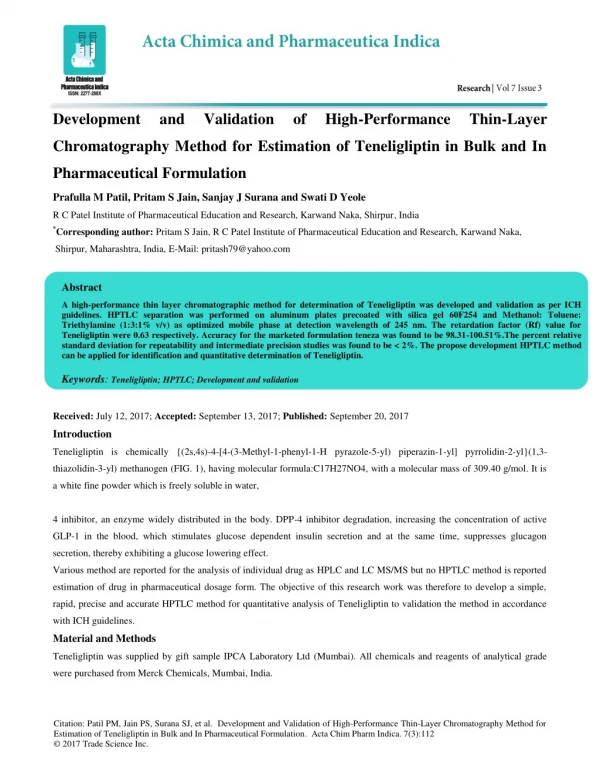
Development and Validation of High-Performance Thin-Layer Chromatography Method for Estimation of Teneligliptin in Bulk and In Pharmaceutical Formulation Prafulla M Patil, Pritam S Jain, Sanjay J Surana and Swati D Yeole R C Patel Institute of Pharmaceutical Education and Research, Karwand Naka, Shirpur, India *Corresponding author: Pritam S Jain, R C Patel Institute of Pharmaceutical Education and Research, Karwand Naka, Shirpur, Maharashtra, India, E-Mail: pritash79@yahoo.com Abstract A high-performance thin layer chromatographic method for determination of Teneligliptin was developed and validation as per ICH guidelines. HPTLC separation was performed on aluminum plates precoated with silica gel 60F254 and Methanol: Toluene: Triethylamine (1:3:1% v/v) as optimized mobile phase at detection wavelength of 245 nm. The retardation factor (Rf) value for Teneligliptin were 0.63 respectively. Accuracy for the marketed formulation teneza was found to be 98.31-100.51%.The percent relative standard deviation for repeatability and intermediate precision studies was found to be < 2%. The propose development HPTLC method can be applied for identification and quantitative determination of Teneligliptin. Keywords: Teneligliptin; HPTLC; Development and validation Received: July 12, 2017; Accepted: September 13, 2017; Published: September 20, 2017 Introduction Teneligliptin is chemically {(2s,4s)-4-[4-(3-Methyl-1-phenyl-1-H pyrazole-5-yl) piperazin-1-yl] pyrrolidin-2-yl}(1,3- thiazolidin-3-yl) methanogen (FIG. 1), having molecular formula:C17H27NO4, with a molecular mass of 309.40 g/mol. It is a white fine powder which is freely soluble in water, 4 inhibitor, an enzyme widely distributed in the body. DPP-4 inhibitor degradation, increasing the concentration of active GLP-1 in the blood, which stimulates glucose dependent insulin secretion and at the same time, suppresses glucagon secretion, thereby exhibiting a glucose lowering effect. Various method are reported for the analysis of individual drug as HPLC and LC MS/MS but no HPTLC method is reported estimation of drug in pharmaceutical dosage form. The objective of this research work was therefore to develop a simple, rapid, precise and accurate HPTLC method for quantitative analysis of Teneligliptin to validation the method in accordance with ICH guidelines. Material and Methods Teneligliptin was supplied by gift sample IPCA Laboratory Ltd (Mumbai). All chemicals and reagents of analytical grade were purchased from Merck Chemicals, Mumbai, India. Citation: Patil PM, Jain PS, Surana SJ, et al. Development and Validation of High-Performance Thin-Layer Chromatography Method for Estimation of Teneligliptin in Bulk and In Pharmaceutical Formulation. Acta Chim Pharm Indica. 7(3):112 © 2017 Trade Science Inc.
www.tsijournals.com | December-2017 FIG. 1. Chemical Structures of Teneligliptin. HPTLC instrumentation the sample were spotted in the form of band 6 mm with a Camag microliter syringe on precoated silica gel aluminium plate 60F254 (20 cm × 10 cm with 0.2 mm thickness, E. Merck, Germany) using a Camag Linomat 5 (Switzerland). A constant application rate of 200 nl/s was employed and space between two bands was 8 mm. the slit dimension was kept 6 mm Х 0.45 mm micro, 20 mm/s scanning speed was employed. The mobile phase consisted of methanol: toluene: triethylamine (1:3:1 v/v). Linear ascending development was carried out in twin through glass chamber saturated with mobile phase. The length of chromatogram run was approximately 75 mm. subsequent to the development; TLC plate was dried in a current of air- dryer. Densitometric scanning was performed on Camag TLC scanner 3 in the absorbance mode at 245 nm. The source of radiation utilized was tungsten lamp Preparation of standard solution and linearity study A standard stock solution of teneligliptin2000 µg/mL was prepared in methanol. From the stock solution 1.0 mL was taken in 10 mL volumetric flask and the vol. was adjusted with methanol to give 100 µg/mL. From this 0.5, 1, 1.5, 2, 2.5 and 3 µl of the solution were spotted on TLC plate to obtain concentration of 500, 1000, 1500, 2000, 2500 and 3000 ng per spot of teneligliptin, respectively. The data of peak area versus drug concentration were treated by linear least square regression. Method Validation Precision Repeatability of sample application and measurement of peak area were carried out using six replicates of the same spot (2000 ng per spot of teneligliptin). The intra-day and inter-day precision for the determination of teneligliptin was carried out at three different concentration levels of 1000, 2000 and 2500 ng per spot. 2
www.tsijournals.com | December-2017 y = 1.055x + 211.43 R² = 0.9982 y = 1.055x + 211.43 R² = 0.9982 area peak FIG. 2. Calibration curve of Teneligliptin. Recovery Recovery studies were carried out by applying the method to drug samples, in which known amount of teneligliptin correspondence to 80, 100 and 120% were spiked. For each stated level, six determination were performed. Robustness The robustness of an analytical procedure refers to its capability to remain unaffected by small and deliberate variation in methanol parameters. Ruggedness Ruggedness of the method was checked by analyzing 2000 ng (n=6) if teneligliptin with the help of two analysts and the variations in the results were checked. Limit of detection and Limit of quantification To determine detection and quantification limit, teneligliptinin the lower levels of the linear range of the calibration curve were use. Teneligliptin solution of 500, 600, 700, 800, 900 and 1000 ng/spot were applied in triplicate. The amount of teneligliptin versus average response (peak area) were plotted in a linear regression equation was determined. The standard deviations of responses were calculated. The average of standard deviation was calculated. Detection limit was calculated by (3.3ХA.S.D)/b and quantification limit was calculated by (10ХA.S.D.)/b, where “b” corresponds to the slope obtained in the linearity study of method. Application of proposed method to tablet formulation Twenty Teneza 20 mg tablet were accurately weighed, average weight determined and crushed into fine powder. A quantity of powdered drug equivalent to 10 mg of teneligliptin was 3
www.tsijournals.com | December-2017 spotted on TLC plates. The plates were developed and scanned as described above. The concentration of the drug was assessed from the linearity curve (FIG. 3). FIG. 3. 3-D linearity chromatogram of Teneligliptin. Result and Discussion Development of optimum mobile phase Different ratios of methanol, toluene and triethylamine were tried as mobile phase was tried but, tailing of spot, less persistent spots were observed in most of the attempts. In order to overcome the problems, methanol: toluene: triethylamine (1:3.1 v/v/v) was tried and result is good resolution, sharp and symmetrical peak with Rf value of 0.63 for teneligliptin (TABLE 1). TABLE 1. Linearity of teneligliptin. Concentration (ng/band) Mean peak area ±SD %RSD 500 683.6 ± 21.56 0.848 1000 1283.6 ± 15.55 0.870 1500 1852.6 ± 15.69 0.847 2000 2363.5 ± 13.43 0.359 2500 2843.9 ± 20.36 0.716 3000 3347.5 ± 13.85 0.215 Calibration curve The linear regression data for the calibration curves showed good linear relationship over the concentration range 500-3000 ng/spot. Linear regression was found to be y = 1.055x + 211.4, slop = 1.055, intercept = 211.4, correlation coefficient = 0.998. 4
www.tsijournals.com | December-2017 Method validation Precision The repeatability of sample application and measurement of peak area were expressed in terms of %R.S.D. and results are depicted in TABLE 2. The intra and inter-day variation of teneligliptin at three different concentration levels of 1000, 2000 and 2500 ng per spot was to be <2%. TABLE 1. Precision study. Concentration Intra-day Inter-day Amount ng/band (n=3) Amount found %RSD found %RSD Area ± SD Area ± SD 1000 1272.7 ± 4.06 0.31926 1274.6 ± 7.20 0.565 2000 2369.23 ± 3.30 0.13963 2373.6 ± 5.51 0.232 2500 2840.97 ± 1.53 0.05388 2831.7 ± 7.76 0.274 Recovery The proposed method when used for extraction and estimation of teneligliptin from pharmaceutical dosage form after spiking with 80, 100 and 120% of additional drug afforded recovery of 98.31-100.51% as listed in TABLE 3. TABLE 3. Recovery study. % amount Initial amount Amount added % Recovery (n=3) %RSD (ng/band) (ng/band) 80 2000 1600 98.31 0.281 100 2000 2000 96.63 0.428 120 2000 2400 100.58 0.127 Robustness studies The robustness of the method was established by introducing small changes in mobile phase composition and chromatograms were run. The amount of mobile phase, chamber saturation time, time from spotting to chromatography and from chromatography to scanning (±10 min) the %RSD calculated as shown in TABLE 4. TABLE 4. Recovery study. Parameters ± SD of peak area ( n = 3) % RSD Mobile phase composition (± 0.5 mL) 8.712 0.489 Mobile phase volume (± 5 ml) 13.28 0.603 Duration of saturation (± 5 min.) 35.46 0.932 5
www.tsijournals.com | December-2017 Ruggedness Ruggedness of the method was pre-formed by applying 2000 ng for teneligliptin, respectively by two different analyst keeping same experimental and environmental conditions. The results summarized in TABLE 5. TABLE 5. Ruggedness study. Analyst Peak area ± SD %RSD 1 2371.18 ± 8.988 0.379 2 2369.62 ± 9.716 0.410 LOD and LOQ The S/N 3:1 and 10:1 was considered as LOD and LOQ. The LOD and LOQ were found to be 67.42 and 204.42. The result summarized in TABLE 6. TABLE 6. LOD and LOQ. LOD (ng/band) LOQ (ng/band) 67.46 204.42 Analysis of tablet formulation A single spot at Rf 0.63 was observed in the chromatogram of the drug sample extracted from tablets. There was no interference from the excipients commonly present in the tablet. The %drug content and %RSD were calculated. The low %RSD value indicated the suitability of this method for the routine analysis of teneligliptin in pharmaceutical dosage forms (TABLE 7). TABLE 7. Analysis of tablet formulation. Conc. (ng/band) Amount found area %Amount found %RSD (ng/band) 2000 2196.34 109.817 0.340 Conclusion The proposed HPTLC methods have been developed and successfully validated for quantitative estimation of Teneligliptin in tablet dosage form. The results of the validation tests indicated that the developed methods were accurate, precise, robust and reproducible. Hence, the developed HPTLC methods are suitable for routine determination of Teneligliptin in pharmaceutical formulation in quality control laboratories, where economy and time are essential. REFERENCES 1.Thirumaran G, Vallnayagam K, Arumugam, R, et al. Antibacterial activity of some selected seaweed from Padumadan Coast regions. Global J Pharmacol, 2009;3:50-52. 6
www.tsijournals.com | December-2017 2.Cahyana AH, Shuto Y, Kinoshita Y. Pyropheophytin a as an antioxidative substance from the marine alga arame (Eisenia bicyclis). Biosci Biotechnol Biochem,1992;56:1533-1535. 3.Aguilera J, Bischof K, Karsten U, et al. Seasonal variation in ecophysiological patterns in macroalgae from an Arctic fjord. II. Pigent accumulation and biochemical defense systems against light stress. Mar Biol, 2002;140: 1087-1095. 4.Cox S, Abu-Ghannam N,Gupta S. An Assessment of the Antioxidant and Antimicrobial activity of six species of Edible Irish seaweeds. Int Food Res Jour, 2010;17:205-220. 5.Matanjun P, Mohamed S, Mustapha NM, et al. Antioxidant activities and phenolics content of eight species of seaweeds from north. Borneo J Appl Phycol, 2008;20:367-373. 6.Dykens JA, Shick JM, Benoit C, et al. Oxygen radical production in the sea anemone Anthopleura elegantissima and endo-symbiotic algae. J Exp Biol, 1992;168:219-241. 7.Matsukawa R, Dubinsky Z, kishimoto E, et al. A comparison of screening methods for antioxidant activity in seaweeds. J Appl Phycol, 1997;9:29-35. 8.Ramarathnam N, Osawa T, Ochi H, et al. The contribution of plant food antioxidants to human health. Trends Food Sci Technol, 1995;6:75-82. 9.Jimenez-Escrig A, Jimenez-Jimenez I, Pulido R, et al. Antioxidant activity of fresh and processed edible seaweeds. J Sci Food Agric,2001;81:530-534. 10.Caroline D, Karthikeyan R, Vijayabaskar P, et al. Ignacimuthu Savarimuthu and Balasubramanian Thangavelu. Inhibition of tumor cell migration and angiogenesis by sulphated polysaccharides from Sargassum wightii (Greville). Cancer Prevention Res, 2008;1:8. 11.Lekameera R, Vijayabaskar P, Somasundaram ST. Evaluating antioxidant property of brown alga Colpomenia sinuosa (Derb. ET sol). African J Food Sci,2008;2:126-130. 12.Ye H, Wang K, Zhou C, et al. Purification, antitumor and antioxidant activities in vitro of polysaccharide from the brown seaweed sargassum pallidum [J]. Food Chem, 2008;111:422-432. 13.Sujatha L, Govardhan L, Rangaiah S. Antibacterial activity of green seaweeds on oral bacteria. Ind. J. Nat Prod Res,2012;3:328-333. 14.Zbakh H,Chiheb H, Bouziane H, et al. Antibacterial activity of benthic marine algae extracts from the Mediterranean coast of Morocco. J Mic Biotech Food Sci,2012;2:219-228. 15.Radhika D, Veerabahu C, Priya R. Antibacterial activity of some selected seaweeds from the Gulf of Mannar coast, South India. Asian J Pharm Clin Res, 2012;5:89-90. 16.Ganesan P, Kumar CS,Bhaskar N. Antioxidant properties of methanol extract and its solvent fractions obtained from selected Indian red seaweeds. Bioresource Technol, 2008;99:2717-2723. 17.Duan XJ, Zhang WW, Li XM, et al. Evaluation of antioxidant property of extract and fractions obtained from a red alga, Polysiphonia urceolata. Food Chem, 2006;95:37-43. 18.Manivannan K, Karthikaidevi G, Anantharaman P, et al. Antimicrobial potential of selected brown seaweeds from Vedalai coastal waters, Gulf of Mannar. Asian Pac J Trop Biomed, 2011;1:114-120. 7