Download
1 / 36
360 likes | 519 Vues
Fiscal Policy in Korea for building Infrastructure and its Knowledge based economy . October 9, 2003 WB-Vietnam-Korea Conference on Public Expenditure Moon-Kyu Bang Ministry of Planning and Budget Republic of Korea . Contents .

E N D
Fiscal Policy in Korea for building Infrastructure and its Knowledge based economy October 9, 2003 WB-Vietnam-Korea Conference on Public Expenditure Moon-Kyu Bang Ministry of Planning and Budget Republic of Korea
Contents I. Korea’s Public Expenditure in building SOC and Knowledge based economy II. Korea’s Building Infrastructure III. Korea’s Transition into Knowledge Based Economy • Knowledge Revolution in Korea • Its strategy for building a KBE
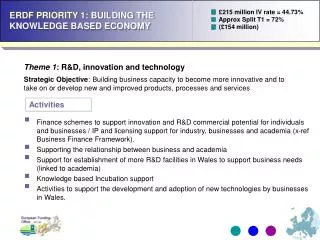
I-1. Korea’s Economic Miracle Per capita GDP Thousands of 1985 international dollars Korea’s GDP/Capita growth(61-96) : average 7.9% GDP per capita(PPP): US$14,731(96), US$17,380(00) 8 Rep. of Korea Difference attributed to Knowledge 6 4 Difference due to physical and human capital 2 Ghana 0 1958 1962 1966 1970 1974 1978 1982 1986 1990 1 Source: WBI knowledge for development program
• Korea’s public expenditure has focused on building • - physical capital (SOC) and human development, • - its knowledge based economy. • < Expenditure ratio by sectors in the integrated public finance (%) > • ‘70 ‘80 ‘90 ‘97 ‘03 economic development 27.7 28.5 30.5 31.2 25.0 education 16.7 14.6 17.0 16.4 15.1 socail welfare 6.2 6.7 9.8 10.5 16.4 • Expenditure in economic development and education is very • high compared with other countries. USA(01) UK(99)Japan(recent)Korea(03) economic development 9.3 6.6 16.2 25.0 education 1.9 3.7 6.0 15.1 socail welfare 50.1 51.9 38.4 16.4 2. Public Expenditure for this Miracle 2
For 40 yrs, SOCinvestment has been very high • < Public SOC investment ratio to GDP (%, 2000) > Korea France Germany UK Itary • 2.9 1.0 1.2 0.9 0.6 • • SOC investment ratio to total size of general account • : 11.1 % (‘93) 15.9 % (03) •Huge jump in SOC stock accumulation but still way to go : SOC Stock value in 1995 price 0.7 (‘68) 388.3 trillion won (‘97) •40 yrs investment SOC Stock is still small <Stock of transportation facilities to GDP* (%, 1999)> Korea Japan USA UK Germany 42 61 73 114 91 (* accumulation ratio) Korea’s Public investment to SOC 3
Public Expenditure to support KBE Aggressive Investment in R&D, Education and IT infra R&D investment : 2.9% of GDP, 4.8% of cetral government budget < R&D investment ratio to GDP (IMD,2003, %) > KoreaUSAJapanFrance UK 2.92 2.80 2.98 2.20 1.85 Education has been a stepping stone for Korea’s miracle < Expenditure ratio to the Integrated Public Finance (%) > USA(01) UK(99)Japan(recent) Korea(03) education 1.9 3.7 6.0 15.1 Investment in IT infra and training - For 3 yrs (00~02), 7.9 trillion won invested (annually 2% of IPF) - Information highway : 1.2 trillion won (95~03) 4
Economy •Take-off (‘60s) : launched the 1st 5 yr economy development plan • Export-oriented policy : policy loan, promoting general exporters • Top 5 Exports: Iron, Tungsten, Silk, Anthracite, Cuttlefish Key Policies • develope Seoul-Pusan Highway, Pusan Port • focus on steam power plant (urgent needs) • main resources from foreign borrowing • KIST (‘66) • expand primary education a. Initial industrialization: ‘60s 5
Economy • Promoting Heavy and Chemical Indusry (HCI) - HCI ratio to manufacturing: 41 51% • Top 5 Exports: - Textiles, Plywood, Wigs, Iron Ore, Electronics Key Policies •Building SOC investment system : National Land Development Plan • Seoul Metro, Honam Highway, yongdong Highway, Industrial complex • nuclear power plant - able to supply electricity more than demands • established KDI (‘71) b. Accelerated industrialization: 70’s 6
Economy • Industry Restructuring : expansion upgrading • Top 5 Exports : Textiles, Electronics, Iron & Steel Products, Footwear, Ships Key Policies • high growth, trade surplus inflation pressure slow SOC investment SOC shortage high cost • develop LNG base, regional energy supply system •upper secondary & tertiary education (Vocational HS & Junior Colleges) • National R&D program c. Industry rationalization : 80s 7
Economy •Competitiveness, Knowledge-based Economy • Top 5 Exports: 1990: Electronics, Textiles, Footwear, Iron & Steel Products, Ships 2000: Semiconductor, Motor Cars, Computers, Ships, Petroleum Products Key Policies • Established the special account for transportation facilities • private investment to SOC • Inchon Airport, High speed railway •Informatization highway project : 97-05, 831 bllion won • E-government project (01~07) : 1 trillion won • Public investment in higher ed. d. Transition into KBE: 90s~03 8
II-1. Korea´s SOC Investment • During ‘60~‘02, average growth of SOC investment is 14.5 %, • much higher than GDP growth : 7.9 % during ‘61~’99 • SOC investment ratio to GDP : 0.6 % (‘60) 5.6 %(‘02) 60 70 80 90 00 02 - SOC (A) Investment 0.1 1.4 5.7 15.4 31.3 29.2 - GDP (B) 16.3 56.2 115.0 263.4 478.5 524.7 - SOC/GNP(B/A, %) 0.6 2.4 5.0 5.8 6.5 5.6 (trillion won=about $ billion, 1995 price) 9 (The value in 1960 is adjusted by 1970 value)
Infrastructure Investment and Ratio to GDP (billion won, (%) , 1995 price) (Bank of Korea) 10
II-2. Mobilizing Resources for Soc Investment • Investment Increase rate (%) • 60s 70s 80s 90s 00s • 30.1 15.4 10.3 7.4 15.5 • In 60s : Foreign borrowing (World Bank, countries) • In 70s : building SOC investment system • • Budget expenditure in SOC increased • • National Land Developmet Plan • In 80s : slows down to avoid inflation pressure from • current account surplus (low oil price, strong Yen) high transportation cost and weak competitiveness in 90s. 11
In 90s : Expansion of public spending to stimulate economy • •SOC investement ratio to general account • 11.1 % (93) 14.2% (97) 15.9 % (03) • •The special account for transportation facilities opened - It sets up a stable base to mobilize funds for SOC investment - Main revenue : transportation tax, fee, etc. - 5 sub accounts for road, railway, port, airport, etc. • Private Investment Promotion Law (95) established - During 90~01, total 33.2 billion US$ is invested - Private investment ratio to SOC in general account increases. : 0.2% (95) 9.6% (02) •SOC for building knowledge based economy strengthened - Informatization highway (97-05, 831 billion won) - E-government project (01~07, 1 trillion won) 12
II-3. Soc Indicator in Asian countries SOC total Road Railway Airport Port etc. (10 point) (㎞/㎢)(㎞/㎢) (1,000 person) (10 point) - Korea 4.51 0.88 0.0313 31,319 4.74 (rank) (29) (20) (18) (8) (38) - Singapore 8.66 4.71 0.0002 15,283 8.76 (1) (2) (47) (20) (3) - Malaysia 5.68 0.17 0.0059 14,985 6.45 (18) (38) (37) (22) (22) - Japan 5.48 3.05 0.0533 105,960 6.85 (1) (4) (16) (2) (19) 14
III. Krea’s transition to Knowledge Eeconomy 1. Background : Fundamental Problems in economy Resource / Input-Based Economic Growth Solve the High-Cost Structure McKinsey Booz Allen&Hamilton Productivity Reality of 8 Industries (Half of USA) Knowledge Gap Second-Tier Korea Productivity Gap Korea’s World Competitiveness declines :26 (‘95) 30 (‘97) 41(‘99) Advanced Nations Knowledge-Based, productivity-led Economic Growth Strategy 15
Road Map to KBE: Background and Proceeding ? Crisis Management (-6.7 % G) Setback & Regaining (3.0% -> 6.2 %) IMF Crisis Rebound & Recovery (10.9 % ---> 9.3%) Macro NEAC 12 ‘01-02 1999 ‘00 ‘97 ‘98 4 12 11 10 5 1 Public Hearing Policy Forum (KDI -MOFE) Research Project Implementation Strategy Report 3-Years Action Plan Presidential Mandate KBE The WB joined (W B-OECD: Korea’s KBE Report) Knowledge Campaign by the Press (e.g.Vision Korea Campaign) Booze-Allen-Hamilton Report McKinsey Report Monitor Report 16
3. Moving into a Knowledge driven economy 1. Government : Strong Push - Cyber Korea 21 (99) : Top 10 Informatization Country - The 3-yr Action Plan for Knowledge based economy: 00-02 - SOC for building knowledge based economy strengthened : Informatization highway (97-05, 831 bllion won) : E-government project (01~07, 1 trillion won) 2. Media : improving public awareness - Maeil Business Newspaper, Vision Korea Campaign (96) 3. Private sector - knowledge management boom, cultural changes in work place 4. Venture Movement - KOSDOQ market opened in 1996 (like US NASDOQ) - 380 venture firms listed - Total Mk Value/GDP: 11% 17
Push to Internet Uses • IT training during 99~04 : 190 billion won • - 15 million people (housewives, soldiers, students, etc.) • Various programs conducted • - Internet PC Drive : Supplied 2 Million Low-Price PCs in 1999) • - Internet Skills Education for 10 Million Students • - Internet Skills Education for 2 Million Housewives • (Partnership with 1,057 private institutions) • - Internet Skills Education for 100,000 Elder Citizens • - Internet Skills Education for 600,000 Soldiers • - One Million Free Homepages • - Ten Million Free Internet Ids • -Used PC Donations to Schools 18
Nationwide Informatization (as of 2002) • Internet Users : 26 mil. (total population 47.6 mil.) • High Speed internet : 19 per 100 persons (world 1st) • Mobile phone service : 68 per 100 persons • Internet Banking: 31%, Cyber trading: 67 % 1998 2002 • E-procurement rates : 19.3 % 91.6 % (‘03) • Customs process for imports : 2 days 2.5 hrs • Low income Internet users : 5.0 % 34.9 % • Female internet users : 7.7 % 52.4 % 19
IT Industry is a new Growth Engine in Korea IT industry grows fast in its production, exports and creates jobs. IT Industry GDP growth (‘97-’02): 21.6 % 5.6 % 1998 2002 IT share of GDP (%) 9.3 14.9 IT export share (%) 23.0 29.4 Mobile phone set exports (US $ bil.) 1.8 8.9 No. of IT companies (thou.) 10.2 22.1 No. of IT employees ( mil.) 1.0 1.2 Korea’s World leading producer: CDMA, TFT-LCD, D-RAM,etc. 20
4. Korea’s IT boom Model Market changed. a. Created huge Demands - Old Generation: Cyber trading rate, 69% (commission charge : 3% 0.3%) - Young Generation: Computer game, “Starcraft” b. Competition brought huge Supply; new tech cost down - PCS in mobile telecom ( mobile phone price : 1/10th) - ADSL in high speed internet ( connection fee : $12) - PC café for online- computer game and cyber trading ($1 per hour) Government : facilitating changes in market - Demand: training, banning s/w copy, low-priced PC policy - Supply Side : building IT Infra, supporting venture startups (KOSDAQ) and e-commerce, educating IT experts * For Cyber 21 project (Mar.99-02), the gov’t invested US$19.7 billion * Informatization highway (97-05, 831 billion won) 21
5. Key Factors of this Success Strong leadership and Entrepreneurship - envisioning goals and strategy “We fell behind in the industrial revolution but we won’t be left behind in the Information revolution” (The President Kim’s Speech to the Parliament, ‘00) Aggressive Investment in R&D, Education and IT infra IT manufacturing Power and Chaebol’s Deep Pockets - Korea’s IT h/w production’s ranked as 4th with 6.3% in the world market - DRAM production (1st) : market share: 38% (00) 41.5% (01) - TFT-LCD production (2nd) : market share: 42% (01, 2/4) 37% (02, 1/4) - Mobile phone production : market share: 6.5%(2000) 10.5%(2001) : CDMA market share: 53.7%(00) 22
Cultural characteristics suitable for Internet - Well educated population : high teciary education - Tendency to follow fashion internet community, game - Quick temper, living pattern (apartments) broadband internet, cyber apartment program(99) - Shyness to public active participation in cyber space IT Boom changes Korean Culture and Value System - Knowledge & Technology (=make money) became a key to success in life - Confucian Value has been changing into performance, Market Value system Saving face, reputation, seniority, modest show up, self-expression, money - chaebol based business culture (lifetime employment) venture (risk taking) 23
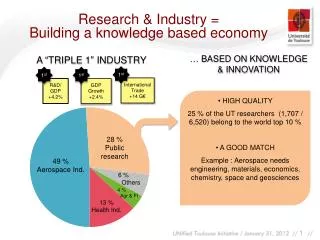
26,270 20,000 19,040 18,000 16,000 14,000 10,860 12,000 10,000 8,000 6,000 3,103 4,000 1,634 731 366 2,000 0 2002 1995 1996 1997 1998 1999 2000 Internet Users in Korea 24
(14.9%) (13.1%) (12.9%) (11.2%) (9.3%) 26
World’s Top Broadband Internet Users rate USA Korea UK OECD 27
- In 2001, Mobile phone users : 29 million (617 per 1,000 people) - mobile internet handsets : 23.8 million 30
Korea holds 53.7% of world CDMA mobile handset market which was US $14 billion in 2000. 31
IV. Prospect and Implication Korea has effectively invested for building SOC and its knowledge economy, which enables its eonomic success - Korea’s investment in Knowledge to GDP is ranked as 3rd in the world. Korea’s experience implies that the government should have an effective strategy for developing its economy by stages. - In the early stage, primary education, steam power plant focussed - After building capacity, investment in knowledge strengthened But in 00s, huge demands for public expenditure in - welfare including pension, medicare, etc. - regional development and supports for S-North Korea relation Under this constraints, it’s important to continue effective investment to SOC and KBE to sustain Korea’s succss 32
Korea’s Investment in Knowledge : world top three * OECD Science, Technology and Industry Scoreboard 2001-Towards a knowledge-based economy 33