Download
1 / 1
10 likes | 130 Vues
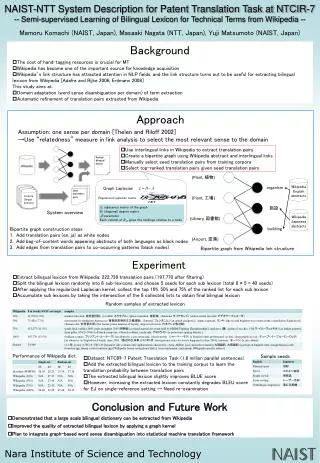
The CReSIS data access system for mapping ice thickness is inadequate, requiring users to know data collection dates. This project proposes an interactive map showing flight paths to improve data accessibility. Originally intended for MATLAB, OpenLayers—a JavaScript library—was chosen for its user-friendly interface. KML files containing flight path data were created and successfully integrated into a web-based map of Greenland. The new system allows users to select areas of interest, leading them to the associated ice thickness data and setting a foundation for future enhancements.

E N D
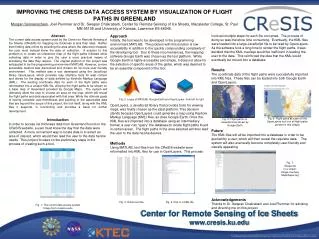
IMPROVING THE CRESIS DATA ACCESS SYSTEM BY VISUALIZATION OF FLIGHT PATHS IN GREENLANDMorgan Sonnenschein, Joel Plummer and Dr. SwapanChakrabarti, Center for Remote Sensing of Ice Sheets, Macalester College, St. Paul MN 55105 and University of Kansas, Lawrence KS 66045. Abstract The current data access system used by the Center for Remote Sensing of Ice Sheets (CReSIS) for mapping ice thickness is less than ideal. Rather than finding data online by selecting the area where the data were mapped, the user must instead know the date of collection. A solution to this problem is to create an interactive map of the flight paths followed while collecting data in order to give the user a more practical means of accessing the data they require. The original platform of this project was anticipated to be the programming environment MATLAB. However, a more accessible method was discovered and chosen for its more user friendly environment. This method was a tool developed using the JavaScript library OpenLayers, which provides map interface tools for web content and allows for the display of data defined by Keyhole Markup Language (KML). The existing coordinate data for each of the flight paths were reformatted into a unique KML file, allowing the flight paths to be shown on a base map of Greenland provided by Google Maps. The system will ultimately allow the user to choose an area on the map, which will reveal the flight paths and data associated with that area. While the ultimate goals of having complete user-friendliness and pointing to the associated data files are beyond the scope of this project, the tool itself, along with the KML files it supports, is functioning and provides a basis for further development. Introduction In order to access ice thickness data from Greenland found on the CReSIS website, a user must know the day that the data were collected. A more convenient way to locate data is to select an area of interest, which would then lead the user to the data he/she needs. This project focuses on the preliminary steps in the process of creating such a tool. Fig. 1: The current data access system Image from cresis.ku.edu Approach Initially, the tool was to be developed in the programming environment MATLAB. The problem with this solution is low accessibility in addition to the quickly compounding complexity of the developing tool. Due to these inconveniences, the mappingsoftware Google Earth was chosen as the tool platform. While Google Earth is highly accessible and simple, it does not allow for the selection of specific areas of the globe, which was deemed to be an essential component of the tool. Fig. 2: Logos of MATLAB, Google Earth and OpenLayers, from left to right OpenLayers, a JavaScript library that provides tools for viewing maps, was finally chosen as the ideal platform. This decision stands because OpenLayers could generate a map using Keyhole Markup Language (KML) files, as does Google Earth. Once the KML files are imported into a database using an intermediary format, a user can “query” the database to locate flight paths found in certain areas. The flight paths in the area selected will then lead the user to the data he/she desires. Methods Using MATLAB, text files from the CReSIS website were reformatted into KML files for use in OpenLayers. This process Fig. 3: Online text file Fig. 4: Part of a KML file involved multiple steps for each file converted. The process of doing so was therefore time consuming. Eventually, the KML files were loaded into a large JavaScript file to be read by OpenLayers. As the software took a long time to render the flight paths, it was decided that the KML overlays would be inefficient in leading the user to the data. This reinforced the idea that the KML would eventually be moved into a database. Results The coordinate data of the flight paths were successfully imported into KML files. These files can be loaded into both Google Earth and OpenLayers. Future The KML files will all be imported into a database in order to be queried by a user, which will then reveal the requisite data. The system will also eventually become completely user-friendly and visually appealing. Acknowledgements Thanks to Dr. SwapanChakrabarti and Joel Plummer for advising and directing me on this project. Fig. 6: Flight paths as seen on the OpenLayers tool (not all flight paths present in this image) Fig. 5: Flight paths on Greenland as shown by Google Earth Fig. 7: Shape file in a viewer. Image courtesy Mapshaper.org