Overview of Supervised Learning
Overview of Supervised Learning. Outline. Linear Regression and Nearest Neighbors method Statistical Decision Theory Local Methods in High Dimensions Statistical Models, Supervised Learning and Function Approximation Structured Regression Models Classes of Restricted Estimators

Overview of Supervised Learning
E N D
Presentation Transcript
Outline • Linear Regression and Nearest Neighbors method • Statistical Decision Theory • Local Methods in High Dimensions • Statistical Models, Supervised Learning and Function Approximation • Structured Regression Models • Classes of Restricted Estimators • Model Selection and Bias Overview of Supervised Learning
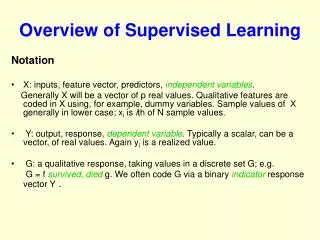
Notation • X: inputs, feature vector, predictors, independent variables. Generally X will be a vector of p values. Qualitative features are coded in X. • Sample values of X generally in lower case; xi is i-th of N sample values. • Y: output, response, dependent variable. • Typically a scalar, can be a vector, of real values. Again yi is a realized value. • G: a qualitative response, taking values in a discrete set G; e.g. G={ survived, died }. We often code G via a binary indicator response vector Y. Overview of Supervised Learning
Problem • 200 points generated in IR2 from a unknown distribution; 100 in each of two classes G={ GREEN, RED }. • Can we build a rule to predict the color of the future points? Overview of Supervised Learning
Linear regression • Code Y=1 if G=RED, else Y=0. • We model Y as a linear function of X: • Obtain bby least squares, by minimizing the quadratic criterion: • Given an model matrix X and a response vector y, Overview of Supervised Learning
Linear regression Overview of Supervised Learning
Linear regression • Figure 2.1: A Classification example in two dimensions. The classes are coded as a binary variable (GREEN=0, RED=1) and then fit by linear regression. The line is the decision boundary defined by . The red shaded region denotes that part of input space classified as RED ,while the green region is classified as GREEN. Overview of Supervised Learning
Possible scenarios Overview of Supervised Learning
K-Nearest Neighbors Overview of Supervised Learning
K-Nearest Neighbors • Figure 2.2: The same classification example in two dimensions as in Figure 2.1. The classes are coded as a binary variable (GREEN=0, RED=1) and the fit by 15-nearest-neighbor. • The predicted class is hence chosen by majority vote amongst the 15-nearest neighbors. Overview of Supervised Learning
K-Nearest Neighbors • Figure 2.3: The same classification example are coded as a binary variable ( GREEN=0, RED=1), and then predicted by 1-nearest-neighbor classification. Overview of Supervised Learning
Linear regression vs. k-NN Overview of Supervised Learning
Linear regression vs. k-NN • Figure 2.4: Misclassification curves for the simulation example above. a test sample of size 10,000 was used. The red curves are test and the green are training error for k-NN classification. The results for linear regression are the bigger green and red dots at three degrees of freedom. The purple line is the optimal Bayes Error Rate. Overview of Supervised Learning
Other Methods Overview of Supervised Learning
Statistical decision theory Overview of Supervised Learning
回归函数 Overview of Supervised Learning
Bayes Classifier Overview of Supervised Learning
Bayes Classifier • Figure 2.5: The optimal Bayes decision boundary for the simulation example above. • Since the generating density is known for each class, this boundary can be calculated exactly. Overview of Supervised Learning
Curse of dimensionality Overview of Supervised Learning
Linear Model • Linear Model • Linear Regression • Test error Overview of Supervised Learning
Curse of dimensionality Overview of Supervised Learning
Statistical Models Overview of Supervised Learning
Supervised Learning Overview of Supervised Learning
Two Types of Supervised Learning Overview of Supervised Learning
Learning Classification Models Overview of Supervised Learning
Learning Regression Models Overview of Supervised Learning
Function Approximation Overview of Supervised Learning
Function Approximation • Figure 2.10: Least squares fitting of a function of two inputs. The parameters of fθ(x) are chosen so as to minimize the sum-of-squared vertical errors. Overview of Supervised Learning
Function Approximation • More generally, Maximum Likelihood Estimation provides a natural basis for estimation. • E.g. multinomial Overview of Supervised Learning
Structured Regression Models Overview of Supervised Learning
Classes of Restricted Estimators Overview of Supervised Learning
Model Selection & the Bias-Variance Tradeoff Overview of Supervised Learning
Model Selection & the Bias-Variance Tradeoff • Test and training error as a function of model complexity. Overview of Supervised Learning
Page 27 • Ex 2.1; 2.2; 2.4; 2.6 Overview of Supervised Learning