Download
1 / 1
10 likes | 127 Vues
Explore the implementation of HACR algorithm for time-frequency burst search within GEO data analysis environment. Analyze sine-gaussian waveforms injected into simulated and GEO data. Study fluctuations in SNR and estimate arrival time uncertainties.

E N D
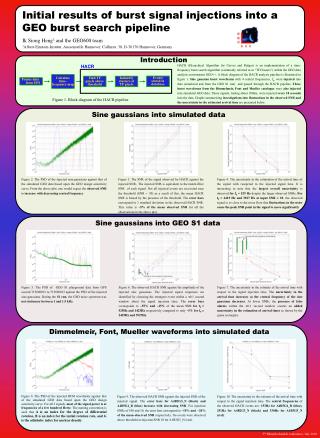
Calculate time- frequency map Events stored in database Find TF pixels above threshold Indentify clusters of TF pixels Frame data from IFO Initial results of burst signal injections into a GEO burst search pipeline Ik Siong Heng1 and the GEO600 team 1Albert-Einstein-Institut, Aussenstelle Hannover, Callinstr. 38, D-30176 Hannover, Germany Introduction HACR (Hierachical Algorithm for Curves and Ridges) is an implementation of a time-frequency burst search algorithm (commonly referred to as “TFClusters”) within the GEO data analysis environment GEO++. A block diagram of the HACR analysis pipeline is illustrated in figure 1. Sine gaussian burst waveforms with 4 central frequencies, f0, were injected into data (simulated and from the GEO S1 run) and passed through the HACR pipeline. Three burst waveforms from the Dimmelmeir, Font and Muellercatalogue were also injected into simulated GEO data. These signals, lasting about 100ms, were injected every 18 seconds into the data. Graphs summarising investigations into fluctuations in the observed SNR and the uncertainty in the estimated arrival time are presented below. HACR Figure 1. Block diagram of the HACR pipeline Sine gaussians into simulated data Figure 2. The PSD of the injected sine-gaussians against that of the simulated GEO data based upon the GEO design sensitivity curve. From the above plot, one would expect the observed SNR to increase with decreasing central frequency. Figure 3. The SNR of the signal observed by HACR against the injected SNR.. The injected SNR is equivalent to the match-filter SNR of each signal. Not all injected events are recovered near the threshold (SNR = 30) as a result of this, the mean HACR SNR is biased by the presence of the threshold. The error bars correspond to 1 standard deviation in the observed HACR SNR. This value is ~5% of the mean observed SNR for all the observations in the above plot. Figure 4. The uncertainty in the estimation of the arrival time of the signal with resepcted to the injected signal time. It is interesting to note that the largest overall uncertainty is observed forf0 = 529Hz despite the larger observed SNRs. Forf0 = 2419 Hz and 3927 Hz at input SNR = 10, the observed signal is so close to the noise floor that fluctuations in the noise cause the peak SNR point in the signal to move significantly. Sine gaussians into GEO S1 data Figure 5. The PSD of GEO S1 playground data from GPS second 715608013 to 715609013 against the PSD of the injected sine-gaussians. During the S1 run, the GEO noise spectrum was not stationary between 1 and 1.5 kHz. Figure 6. The observed HACR SNR against the amplitude of the injected sine gaussians. The injected signal responses are identified by choosing the strongest event within a ±0.1 second window about the signal injection time. The error bars corresponds to ~55% and ~15% of the mean SNR for f0 = 529Hz and 1423Hz respectively compared to only ~5% for f0 = 2419Hz and 3927Hz. Figure 7. The uncertainty in the estimate of the arrival time with respect to the signal injection time. The uncertainty in the arrival time increases as the central frequency of the sine gaussians decreases. At lower SNRs, the presence of false alarms within the ±0.1 second window creates an added uncertainty in the estimation of arrival times as shown by the green rectangles. Dimmelmeir, Font, Mueller waveforms into simulated data Figure 8. The PSD of the injected DFM waveforms against that of the simulated GEO data based upon the GEO design sensitivity curve. For all 3 signals, most of the signal power is at frequencies of a few hundred Hertz. The naming convention is such that A is an index for the degree of differential rotation, B is an index for the initial rotation rate, and G is the adiabatic index for nuclear density. Figure 9. The observed HACR SNR against the injected SNR of the injected signal. The error bars for A4B2G3_N (black) and A4B5G4_R (blue) increase with decreasing SNR. For injection SNRs of 100 and 10, the error bars correspond to ~15% and ~20%of the mean observed SNR respectively. No events were observed above threshold at injection SNR 10 for A1B3G5_N (red). Figure 10. The uncertainty in the estimate of the arrival time with respect to the signal injection time. The central frequencies of the observed HACR events are: 153Hz for A4B5G4_R (blue), 251Hz for A4B2G3_N (black) and 330Hz for A1B3G5_N (red). 5th Eduardo Amaldi conference, July 2003