Download
1 / 28
280 likes | 472 Vues
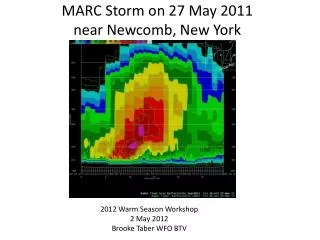
MARC Storm on 27 May 2011 near Newcomb, New York. 2012 Warm Season Workshop 2 May 2012 Brooke Taber WFO BTV. Motivation/Goals. Why damaging winds occurred near Newcomb, NY on 27 May 2011 What is a MARC and how can I use radar data to examine this signature

E N D
MARC Storm on 27 May 2011 near Newcomb, New York 2012 Warm Season Workshop 2 May 2012 Brooke Taber WFO BTV
Motivation/Goals • Why damaging winds occurred near Newcomb, NY on 27 May 2011 • What is a MARC and how can I use radar data to examine this signature • Review environmental conditions favorable for MARC radar signatures • Better understand the MARC signature for improved warning decisions • Interrogate KCXX and KTYX radar data to identify MARC near Newcomb, NY on 27 May 2011 at 2044 UTC • From EOC numerous trees down near Newcomb NY between 2040 and 2045 UTC on 27 May 2011
Pre-Storm Environment • Will examine 18 UTC Albany, NY sounding • Utilize satellite and surface observations to identify boundary • Investigate 250mb and 925mb upper air analysis • Review CAPE and Shear values
Albany, NY 18 UTC Sounding on 27 May 2011 Strong mid level flow of 50 knots • Cape=764 J/kg • LI=-5C • Sfc to 3km=8.2 C/km • EL=34,000 ft • Sfc to 1km shear=17knots
250mb Upper Air Analysis on 27 May 2011 at 12 UTC Right rear quadrant of 100 knot jet at 250mb, enhanced upper level divergence across our region to promote thunderstorm updrafts
925mb Upper Air Analysis on 27 May 2011 at 12 UTC Low level boundary enhanced convergence and helped to initiate thunderstorm development L
Visible Satellite and Surface Observations at 18 UTC on 27 May 2011 Sharp boundary with temps in the 50s across northern NY to 80s across southern VT Strong surface convergence along boundary Note the convective nature with vertical development to the clouds in the warm sector
Meso-Analysis of Lifted Index at 14 UTC on 27 May 2011 Sharp instability gradient associated with boundary across our CWA Newcomb, NY, location of wind damage
RUC40 Most Unstable Cape and Surface Winds at 19 UTC on 27 May 2011 Location of MARC signature and damaging winds 2000 J/Kg 3000 J/Kg 2000 J/Kg Sharp instability gradient across our CWA, helped enhance thunderstorm development
What is a MARCMid-Altitude Radial Convergence(Schmocker and Przybylinski) • The MARC velocity signature is a Doppler radar-velocity based precursor towards forecasting the initial onset of damaging straight-line winds in a linear Quasi-Linear Convective System (QLCS) or bowing convective system. Strong and deep radial convergence at the storm's mid-altitudes (11 - 14 km). • 25 m s-1 velocity difference along three to five (maybe six) radials between the area of outbound to inbound velocities was an initial signal or starting point for damaging winds to occur • Calculating MARC you add the magnitude of the maximum outbound value and the maximum inbound value • Average depth of MARC was 6.2 km. Strongest magnitudes of MARC between 4 and 7 km • Width of radial convergence 2 to 6 km. • The viewing angle is extremely important when viewing the MARC velocity signature. The convective line must be nearly perpendicular to the radial when you are calculating MARC
Storm near Newcomb, NY with similar reflectivity structure of the Schematic MARC diagram in the upper left
KCXX Reflectivity Cross Section near Newcomb, NY at 2046 UTC on 27 May 2011 Over-shooting top Storm top divergence Mid Altitude Convergence Radial (MARC) between 3km and 6km 6KM Descending reflectivity core associated with rear inflow jet 3KM
KCXX Velocity Cross Section near Newcomb, NY at 2046 UTC on 27 May 2011 Note the different position of the cross section line (~60nm KCXX) 6KM Tighter mid level convergence signature due to orientation of line for cross section to the KCXX radar beam 3KM +50 knots descending toward the ground
KCXX Velocity Cross Section near Newcomb, NY at 2046 UTC on 27 May 2011 Distance from radar (~60nm) and angle of beam resulted in broad mid level convergent couplet being detected by KCXX radar Mid Altitude Convergence of 75 knots near Newcomb, NY 6KM 50 knots inbound 25 knots outbound 3KM
FSI of Storm 4 Minutes Prior to Severe Report at Newcomb, NY at 2041 UTC 65 dBZ to 22 kft Well establish reflectivity core aloft, good overhang Poor llvl sampling due to mtns/distance from radar
KCXX Velocity Cross Section near Newcomb, NY at 2046 UTC on 27 May 2011 Mid level convergence of 50 knots inbound and 20 to 30 knots out bound
KCXX Reflectivity Cross Section near Newcomb, NY at 2051 UTC on 27 May 2011 Descending rear inflow jet and associated reflectivity signature Reflectivity overhang associated with strong updraft on forward flank of storm 3KM Bounded Weak Echo Region
KTYX Velocity Cross Section near Newcomb, NY at 2040 UTC on 27 May 2011 Storm top divergence with outbound velocities of 60 to 70 knots MARC signature with 40 to 50 outbound and 10 to 20 knots inbound 6KM 3KM Limited low level sampling due to distance storm is from radar (~80 NM from KTYX)
KCXX Reflectivity Cross Section Loop from 2031 UTC to 2056 near Newcomb, NY on 27 May 2011 6KM
KCXX Vertical Integrated Liquid at 2056 UTC on 27 May 2011 Note small core of VIL reaching the “VIL of the day” threshold
KCXX 5.1° Base Reflectivity at 2046 UTC near Newcomb, NY on 27 May 2011 Short of the 50 to 55 dBZ height of the day 51 dBZ to 27,000 ft AGL
KCXX 1.3°Storm Relative Motion at 2046 UTC Numerous trees down at 2044 UTC Developing anti-cyclonic rotation in comma head of line segment with a rotational velocity signature of -36.7 knots
KCXX 1.3° Base Reflectivity at 2051 UTC Anti-cyclonic rotation in comma head Bowing line segment with comma head Severe wind report at 2040 UTC
KCXX 1.3° Base Reflectivity at 2056 UTC on 27 May 2011 Comma head Bowing line segment near Newcomb, NY Weaker reflectivity associated with descending rear inflow jet caused by the mid altitude convergence several radar scans previous
KCXX 1.3° Base Reflectivity at 2056 UTC on 27 May 2011 Reflectivity outline of bowing line segment Rear inflow jet of 50 to 60 knot at 2500 feet above the ground, which given the environment with steep surface to 3km lapse rates mixed to the surface
Conclusion and Lessons LearnedWhy damaging winds occurred near Newcomb, NY • Max inbound was 50 knots and outbound was 25 knots for a maximum MARC signature of 75 knots near 12,000 feet. • MARC signature between 3km and 6km, slightly less than Central Plain storms due to lower storm top and associated equilibrium levels • The MARC signature was 2 to 3km’s deep and only persisted for 2 or 3 volume scans • It’s extremely critical to determine proper storm motion and draw your line perpendicular to radial • The distance from radar, terrain, and 250 to 260° storm movement made sampling difficult • The viewing angle is extremely important when viewing the MARC velocity signature. The convective line must be nearly perpendicular to the radial when you are calculating MARC • Once again steep surface to 3km lapse rates helped to enhance thunderstorm downdraft (Windex 46)
Conclusion • Anti-cyclonic circulation was present in the developing comma-head of the bowing line segment with a rotational velocity of 37 knots 5 minutes after wind report • Cross sections showed higher reflectivity descending toward the surface, along with the 50 knot winds near Newcomb, NY • The maximum height of the 50 dBZ was only 27,000 feet, well short of the 33,000 to 35,000 feet needed for 1 inch hail • Storm motion of 40 mph, also a good indicator of wind potential