Download
1 / 21
210 likes | 321 Vues
The 2005 Kentucky Land Outlook. Prepared for Economic Subject Matter Meetings October 17-21, 2005 By Richard L. Trimble and Craig D. Gibson Extension Farm Management Specialists. Agricultural Economics.

E N D
The 2005 Kentucky Land Outlook Prepared for Economic Subject Matter Meetings October 17-21, 2005 By Richard L. Trimble and Craig D. Gibson Extension Farm Management Specialists Agricultural Economics
Chart 1. Average Per Acre Value of Farm Real Estate, Kentucky and 48 States, 1912-2005. Source: University of Missouri: http://agebb.missouri.edu/mgt/bull10b.htm. Agricultural Economics
Chart 2. Historical Land Values, US and Kentucky, 1961-2005. Source: Craig D. Gibson, Unpublished data analysis. Agricultural Economics
2004 Land Value Increases Widespread • Average value of farm real estate across 48 United States was $1,510 per acre as of January 1, 2005 • Increase of $150 or 11.0% over 2004 value • Largest dollar increase ever recorded • Largest percentage increase since 1981 Agricultural Economics
Kentucky 2005 Real Estate Values • Average value of Kentucky farm real estate was $2,200 per acre as of January 1, 2005 • Increase of $200 or 10.0% over 2004 value • Largest dollar increase ever • Largest percentage increase since 1980 Agricultural Economics
Positive Influences on Value Increases • Low interest rates • Good commodity yields • Good commodity prices • Strong non-agricultural demand for farm land Agricultural Economics
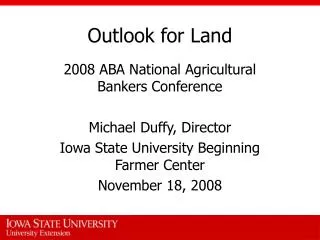
Chart 3. Average Per Acre Value of Farm Real Estate, Kentucky and Surrounding States, 1998-2005. Source: National Agricultural Statistics Service, USDA, Washington, D.C. Agricultural Economics
Chart 4. Average Price, per acre, of Kentucky Agricultural Land, October, 2004 Source: Survey of participants in ESM Meetings, October, 2004 Agricultural Economics
Chart 5. Crop Land Cash Rental Rates, per acre, Kentucky and Surrounding States, 2001-2005 Source: National Agricultural Statistics Service, USDA, Washington, D.C. Agricultural Economics
Chart 6. Crop Land Cash Rent as Percent of Value, Kentucky and Surrounding States, 2001-2005 Source: National Agricultural Statistics Service, USDA, Washington, D.C. Agricultural Economics
Chart 7. Typical Kentucky Crop and Pasture Land Cash Rental Rate, per acre, October, 2004 Source: Survey of participants in ESM Meetings, October, 2004 Agricultural Economics
Outlook Potential Positive Influences • Low interest rates • Good commodity yields • Good commodity prices • Strong non-agricultural demand for farm land Agricultural Economics
Upward Trend in Farmland ValuesWarrants Caution • Rising interest rates • Lower commodity prices • Increasing energy costs • National budget constrains limiting government program payment support • Potential flagging non-agricultural demand Agricultural Economics
Chart 8. Corn and Soybean Gross Income as a Percent of Land Value Source: Craig D. Gibson, Unpublished data analysis. Agricultural Economics
Chart 9. Corn, Soybeans, and Government Payments as a Percent of Land Values, 1970-2005. Source: Craig D. Gibson, Unpublished data analysis. Agricultural Economics
Chart 10. Cash Rent as a Percent of Land Value Source: Craig D. Gibson, Unpublished data analysis. Agricultural Economics
Chart 11. Cash Rent as a percent of Land Values vs 10-Year Bond Rates, 1977-2005. Source: Craig D. Gibson, Unpublished data analysis. Agricultural Economics
Chart 12. U.S. Land Values vs. Yearly Average of Dow Jones Industrials Source: Craig D. Gibson, Unpublished data analysis. Agricultural Economics
Chart 13. U.S. Land Values Compared to the Prime Interest Rate 1975 1980 1985 1990 1995 2000 2005 Source: Craig D. Gibson, Unpublished data analysis. Agricultural Economics
Chart 14. Government Payments per Acre – KFBM Program Land Value per Acre Source: Craig D. Gibson, Unpublished data analysis. Agricultural Economics
What Do You Think Will Happen??? • Strong Kentucky land value increases will continue • Kentucky land values will decrease for first time since 1991 • The upward trend in Kentucky land values will continue, but at a more moderate rate Agricultural Economics