Download
1 / 29
290 likes | 427 Vues
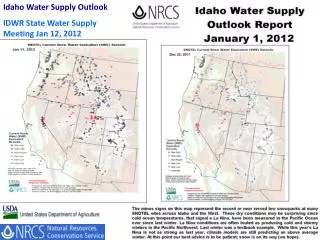
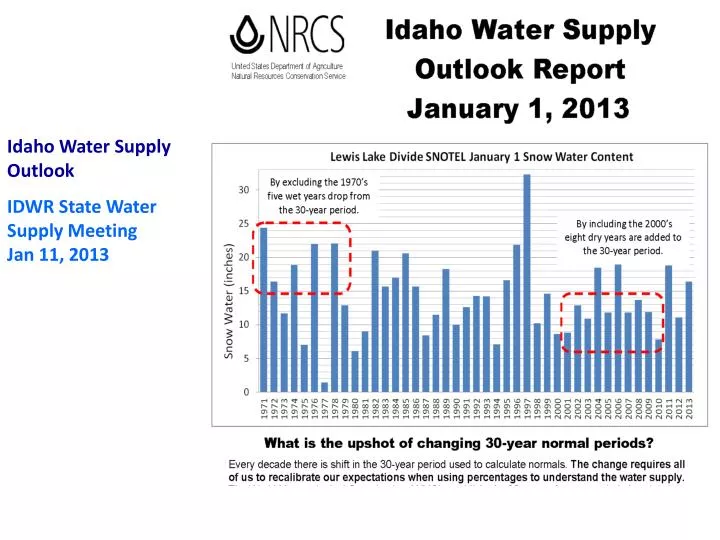
Idaho Water Supply Outlook IDWR State Water Supply Meeting Jan 11, 2013 . Summer 2012 Fires. Trinity Ridge (Boise Basin) 147,000ac. Idaho led the nation in acres burned with 1.7 million acres . Long Draw (Owyhee Basin) 350,000ac. Jacks (Owyhee/Bruneau Basins)

E N D
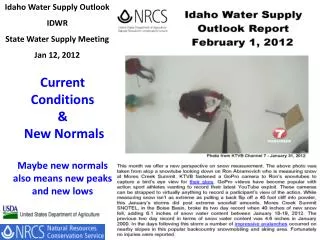
Idaho Water Supply Outlook IDWR State Water Supply Meeting Jan 11, 2013
Summer2012 Fires Trinity Ridge (Boise Basin) 147,000ac • Idaho led the nation in acres burned with 1.7 million acres. Long Draw (Owyhee Basin) 350,000ac Jacks (Owyhee/Bruneau Basins) 51,000ac
Hydrologic Fire Effects: Earlier snowmelt & runoff Forest Fire Impacts on Snowmelt Rates Atlanta Summit vs Jackson Peak for 2000 and 2004
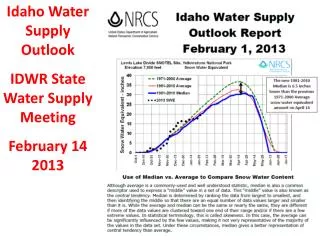
New Normals this Year • Every decade the 30 year normals change periods. • This year we go from the 1971-2000 period to the 1981-2010 period. • The change is meant to keep pace with current climatic conditions as most recent years are said to represent the current conditions. • Most data types will be calculated as a straight average except Snow Water Equivalent which will be the “median” or “middle value”
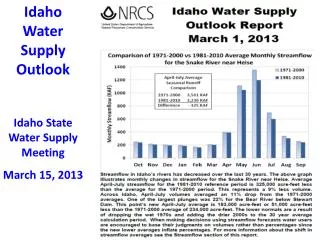
Trade 7 big years for 9 low years Apr-Sep Volumes: 1971-2000 average = 1,526 KAF 1981-2010 average = 1,363 KAF Compare 2012 runoff of 1,600 KAF 105% of 1971-2000 average 117% of 1981-2010 average +12%
Old 1971-2000 vs New 1981-2010 Normals Trade 7 big years for 9 low years Compare 2012 snowpack of 37.9” 95% of 1971-2000 average 107% of 1981-2010 average 1971-2000 average = 39.5” 1981-2010 median = 35.3” +12%
Snow Water % of Normal as of Dec 5th Storms brought several feet of snow in Central Idaho Mountains
+ and – are Near Record High Snow above 6,881 feet: • Deadwood Summit • Lost-wood Divide • Bear Canyon • Stickney Mill • + and – are Near Record Low Snow below 6100 feet: • Cozy Cove • Graham GS • Bogus Basin
2013 Snowpack trends Long range experimental NCEP’s Climate Forecast System Max SWE model compared to current Jan 8, 2013 conditions
2012 annual precipitation was 123% of average. Above normal Fall precipitation primed soils and brought streams to above average levels. This region has already received over 57% of annual precipitation
2012 runoff 80% Forecast range 39 to 113 to 190%
Dec 31, 2012 storage 28.3 KAF 1971-00 average Dec 31 = 23.7 119 % 1981-10 average Dec 31 = 21.9 130%
Forecast range 76 to 100 to 124%
The graphs above, make 2012 look like a normal year, but the way the snow fell, melted with 90F temperatures in early April followed by 1-2” of rain in late April and minimal summer precipitation was anything but normal…. Let’s hope 2013 is a little more normal with these new normals. Questions/Comments