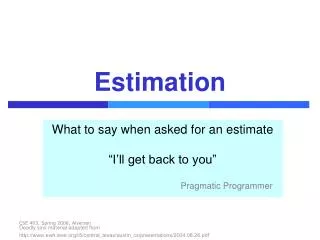
Spectrum Estimation
Learn about AR process basics and 3 estimation methods. Simulate and implement using DSK6713, compare results in real-time.

Spectrum Estimation
E N D
Presentation Transcript
Preface • Our Goal is to Estimate the Spectrum of stochastic processes • We are concentrating in AR-Processes • 3 methods of Estimation will be discussed: Periodogram, Burg and M-Covariance
AR Basics • An Auto-Regressive (AR) process is commonly described as White Noise filtered by an all-pole LTI system: • Frequency domain characteristics: • The AR Process Spectrum is given by: Where:
AR Basics cont. • Time Analysis of the process (of order k): • every sample has correlation with at most k previous samples • The autocorrelation function looks like: • For every n<-k or n>k holds:
Estimation Methods • 3 Methods: • Periodogram • Burg • M-Covariance • Our Goal: • Given a finite buffer of samples of the stochastic process estimate its spectrum • Assumption: • The process is mean Ergodic and Correlation Ergodic
Periodogram • The Periodogram block computes a nonparametric estimate of the spectrum. The block averages the squared magnitude of the FFT computed over windowed sections of the input and normalizes the spectral average by the square of the sum of the window samples.
The Modified Covariance Method • The Modified Covariance Method block estimates the power spectral density (PSD) of the input using the modified covariance method. This method fits an autoregressive (AR) model to the signal by minimizing the forward and backward prediction errors in the least squares sense. The order of the all-pole model is the value specified by the Estimation order parameter. To guarantee a valid output, you must set the Estimation order parameter to be less than or equal to two thirds the input vector length. The spectrum is computed from the FFT of the estimated AR model parameters.
Burg Method • The Burg Method block estimates the power spectral density (PSD) of the input frame using the Burg method. This method fits an autoregressive (AR) model to the signal by minimizing (least squares) the forward and backward prediction errors while constraining the AR parameters to satisfy the Levinson-Durbin recursion.
Hands-On • Simulation • Implementation using the DSK6713 • GUI to handle the R-T implementation
Simulation • The coefficients are known for the model • Internal generation of the true spectrum • Generation of the AR signal using white noise and all-poles filter • Comparison between all 3 methods in the model (to one another and to the true spectrum • The results are presented using the frequency domain
The Simulation Environment • Simulation involves the 3 methods simultaneously
Real-Time Environment • Based on the Simulation model • R-T Implementation contains 3 model files, each implements different method separately • We will present the Top-Down Architecture of the Real-Time solution
Real Time Environment (cont.) PC RTDX DSK6713 CODEC Line Out TMS320C6713 Line In All-pole Filter Spectrum Estimator A/D (Left) D/A (Left) Signal Generator Oscilloscope White Noise Generate Reference Spectrum D/A (Right)
Real Time Environment (cont.) • R-T model using Periodogram Estimation:
GUI Functionality • Using Matlab GUI and TI libraries we will show how to build a gui that enables the user to control the model easily • The GUI involves RTDX calls to negotiate with the DSK in R-T • The RTDX is a proprietary interface that enables the Host to send/receive data to the dsk in R-T • The GUI enables the user to perform the following operations: • Reloading a model (3 optional Estimation methods)
The System Spectrum Noise Estimated Spectrum