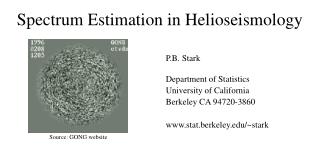
Chap 8. SPECTRUM ESTIMATION
Chap 8. SPECTRUM ESTIMATION. 8.1 INTRODUCTION 8.2 NONPARAMETRIC METHODS 8.2.1 The Periodogram. 김 치 효. 8.1 Introduction. ☞ wide-sense stationary random process 의 power spectral density 의 estimation 에 관한 문제를 고려. Power spectrum autocorrelation sequence 의 Fourier transform.

Chap 8. SPECTRUM ESTIMATION
E N D
Presentation Transcript
Chap 8. SPECTRUM ESTIMATION 8.1 INTRODUCTION 8.2 NONPARAMETRIC METHODS 8.2.1 The Periodogram 김 치 효
8.1 Introduction ☞ wide-sense stationary random process의 power spectral density의 estimation에 관한 문제를 고려 Power spectrum autocorrelation sequence의 Fourier transform autocorrelation ergodic process Fourier transform spectrum estimation 하는데 두가지 어려운 점 1. 수집된 데이터의 양이 무한하지 않고 작거나 유한하다. 2. 노이즈에 오염 되거나 신호의 간섭 스펙트럼 예측은 x(n)에서 유한한 개수의 노이즈 측정으로부터 P()을 예측할 수 있다.
noncausal Wiener smoothing filter Power spectrum of d(n) Power spectrum of the noise, v(n) 응용에 있어서 파워 스펙트럼의 예측은 프로세스가 어떻게 만들어졌는가에 대한 선지식을 알고있다면 쉽게 구할 수 있다. 스펙트럼 예측은 다른 필드나 응용에 있어 중요한 문제이다. 7장에서 공부한 noncausal Wiener smoothing filter의 주파수 응답은 Wiener smoothing filter 를 설계하고 만들기 전에 dn 과 vn의 파워 스펙트럼을 구하여야 한다.
application of spectrum estimation signal detection tracking application 1 소나가 바다 바닥에 위치해 있고 배의 기계나 프로펠러의 회전됨으로써 생기는 특정 영역의 소리 신호를 듣는다고 가정하자 어떤 narrow-band signal이 보호되면 문제의 중요성은 신호의 중심 주파수를 예측하는 것이다. 다시말해 배의 방향이나 속도를 결정하는 것이다. 이런 narrow-band signals은 많은 노이즈가 있는 환경에서 전형적으로 기록되기 때문에 신호의 detection과 주파수의 예측은 강인성과 높은 분해능의 스펙트럼 예측기술에 있어 쉬운 문제가 아니다. Other applications harmonic analysis and prediction, time series extrapolation and interpolation, spectral smoothing, bandwidth compression, beamforming and direction
spectrum estimation classical or nonparametric 파워 스펙트럼은 예측된 autocorrelation sequence를 퓨리에 변환을 함으로써 예측되어 진다. nonclassical or parametric xn이 p차 autoregressive process라고 안다면 xn의 측정값은 all-pole model, a,(k)의 파라미터를 예측하기위해 사용된다. 파워 스펙트럼은 예측된 파라미터를 이용하여 예측된다. 이장에서는 classical or nonparamenic 스펙트럼 예측 기술을 예기한다.
Periodogram and modified periodogram (Bartlett's method, Welch's method, and the Blackman-Tukey method ) Section 8.2 Section 8.3 The minimum variance method The power spectrum at the center frequency of each bandpass filter is then estimated by measuring the power in the narrow-band process and dividing by the filter bandwidth Section 8.4 maximum entropy method (MEM) power spectrum estimation techniques that are based on a parametric model for the data Section 8.5 Section 8.6 frequency estimation algorithms for harmonic processes Section 8.7 principal components frequency estimation
8.2 nonparametric Methods consider nonparametric techniques of spectrum estimation 측정된 데이터로부터 랜덤 프로세스의 autocorrelation sequence를 예측하고 파워 스펙트럼을 예측하기 위해 퓨리에 변환을 수행 periodogram 1898년 Schuster가 태양흑점 수의 주기를 연구하면서 소개 periodogram이 쉽게 계산되더라도 특히 기록된 데이터가 작으면 파워 스펙트럼의 정확한 예측을 하기는 힘들다. modified periodogram - statistical properties의 개선 Bartlett's method Welch's method Blackman-Tukey method
8.2.1 The Periodogram wide-sense stationary random process의 파워 스펙트럼은 autocorrelation sequence의 퓨리에 변환 Spectrum estimation is an autocorrelation estimation problem. autocorrelation sequence rxk autocorrelation ergodic process이고 데이터가 무한대 일 때 autocorrelation sequence는 time-average를 사용하여 결정 n = 0, 1 , . . . , N - 1 의 유한한 주기
(defined using conjugate symmetry ) = 0 Taking the discrete-time Fourier transform of leads to an estimate of the power spectrum known as the periodogram,
Let xN(n) be the finite length signal Thus, xN(n) is the product of x(n) with a rectangular window In terms of xN(n) , the estimated autocorrelation sequence may be written as follows: ?? Taking the Fourier transform and using the convolution theorem, the periodogram becomes discrete-time Fourier transform of the N-point data sequence xN(n)
periodogram Example 8.2.1 Periodogram of White Noise If x(n) is white noise with a variance of then and the power spectrum is a constant,
A sample realization of unit variance white noise of length N=32 The estimated autocorrelation sequence The periodogram along with the true power spectrum, =1 Which is indicated by the dotted line.
FIR filter of length N The frequency response of this filter bandpass filter center frequency wi Bandwidth ∆w = 2∏/N
If a WSS random process x(n) is filtered with hi(n), then the output process is Since If the bandwidth of the filter is small enough so that the power spectrum of x(n) may be assumed to be approximately constant over the passband of the filter, then the power in yi(n) will be approximately
One-point sample average From Eq.(8.13) we see that this is equivalent to Therefore Which is equivalent to the periodogram. Thus, the periodogram may be viewed as the estimate of the power spectrum that is formed using a filter bank of bandpass filters as illustrated in Fig. 8.4, with being derived from a one-point sample average of the power in the filtered process n=N-1 대입 후 제곱