Download
1 / 1
20 likes | 184 Vues
Aliasing Effectively Goes Away (!) Signal: 2 sinusoids at 39 and 41 Hz Sampling: randomly sampled 100 times in 2 Sec. Experimental Results A. Signal: 3 sinusoids at 19,20, and 21 Hz, white noise with variance 0.001 Sampling: Evenly sampled at 50 Hz in 1.5 Sec. Lomb. New.

E N D
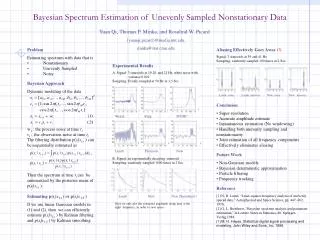
Aliasing Effectively Goes Away (!) Signal: 2 sinusoids at 39 and 41 Hz Sampling: randomly sampled 100 times in 2 Sec. Experimental Results A. Signal: 3 sinusoids at 19,20, and 21 Hz, white noise with variance 0.001 Sampling: Evenly sampled at 50 Hz in 1.5 Sec. Lomb New New (Smoothed ) Lomb, uneven New, uneven Lomb, even New, even • Conclusion • Super-resolution • Accurate amplitude estimate • Instantaneous estimation (No windowing) • Handling both unevenly sampling and nonstationarity • Joint estimation of all frequency components • Effectively eliminates aliasing • Future Work • Non-Gaussian models • Bayesian deterministic approximation • Particle filtering • Frequency tracking • Reference • [1] N. R. Lomb, “Least-squares frequency analysis of unevenly spaced data,” Astrophysical and Space Science, pp. 447–462, 1976. • [2] G. L. Bretthorst, “Bayesian spectrum analysis and parameter estimation,” in Lecture Notes in Statistics, 48. Springer-Verlag,1988. • [3] M. H. Hayes, Statistical digital signal processing and modeling, John Wiley and Sons, Inc, 1996. f f f B. Signal: an exponentially decaying sinusoid Sampling: randomly sampled 1000 times in 2 Sec. f f f Welch Burg MUSIC Here we only plot the estimated amplitude along time at the right frequency, in order to save space. Lomb Thomson New Bayesian Spectrum Estimation of Unevenly Sampled Nonstationary Data Yuan Qi, Thomas P. Minka, and Rosalind W. Picard {yuanqi,picard}@media.mit.edu, minka@stat.cmu.edu • Problem • Estimating spectrum with data that is • Nonstationary • Unevenly Sampled • Noisy • Bayesian Approach • Dynamic modeling of the data wi : the process noise at time ti vi: the observation noise at time ti. The filtering distribution p(si|x1:i ) can be sequentially estimated as Then the spectrum at time ti can be summarized by the posterior mean of p(si|x1:i ). Estimating p(si|x1:i )or p(si|x1:T ) If we use linear Gaussian models in (1) and (2), then we can efficiently estimate p(si|x1:i ) by Kalman filtering and p(si|x1:T ) by Kalman smoothing.