Download
1 / 22
220 likes | 237 Vues
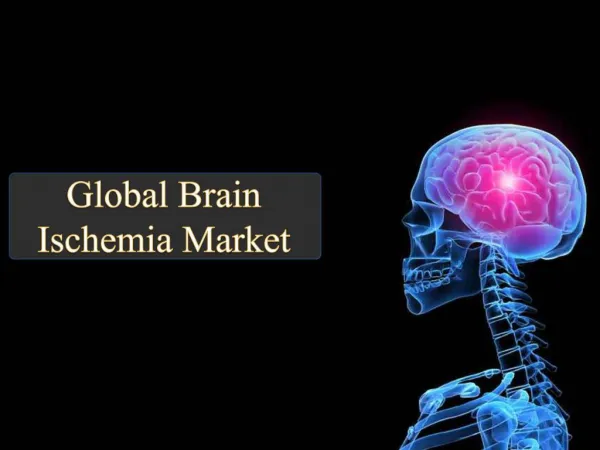
The global brain imaging modalities market report highlights that the market was valued at $12,334.2 million in 2021 and is expected to reach $20,209.2 million by the end of 2031. The market is expected to grow at a CAGR of 5.06% during the forecast period 2022-2031.

E N D
Global Brain Imaging Modalities Market - A Global and Regional Analysis Table of Content https://www.shutterstock.com/image-photo/mri-image-head-showing-brain-227580421 Focus on Product Type, Patient Age, End User, and Regional Analysis Analysis and Forecast: 2022-2031 February 2022 1
BIS Research is a leading market intelligence and technology research company. BIS Research publishes in-depth market intelligence reports focusing on the market estimations, technology analysis, emerging high- growth applications, deeply segmented granular country-level market data and other important market parameters useful in the strategic decision making for senior management. BIS Research provides multi- client reports, company profiles, databases, and custom research services. Copyright © 2022 BIS Research Inc. All Rights Reserved. This document contains highly confidential information and is the sole property of BIS Research. Disclosing, copying, circulating, quoting, or otherwise reproducing any or all contents of this document is strictly prohibited. Access to this information is provided exclusively for the benefit of the people or organization concerned. It may not be accessed by or offered whether for sale or otherwise to any third party. 2
Table of Content Executive Summary .................................................................................... 22 1. Markets ................................................................................................. 31 1.1 Market Outlook ................................................................................................. 32 1.1.1Product Definition ....................................................................................... 32 1.1.2Inclusion and Exclusion Criteria ................................................................ 33 1.1.3Key Findings ................................................................................................ 33 1.1.4Assumptions and Limitations .................................................................... 34 1.1.5Global Market Scenario ............................................................................... 35 1.1.5.1 Realistic Growth Scenario ................................................................................. 35 1.1.5.2 Optimistic Growth Scenario ............................................................................... 36 1.1.5.3 Pessimistic/Conservative Growth Scenario ....................................................... 36 1.2 Industry Outlook .............................................................................................. 37 1.2.1Key Trends ................................................................................................... 37 1.2.2Opportunity Assessment ............................................................................ 38 1.2.2.1 Short-Term Potential .......................................................................................... 38 1.2.2.2 Long-Term Potential .......................................................................................... 39 1.2.3Patent Analysis ............................................................................................ 40 1.2.3.1 Awaited Technological Developments ............................................................... 40 1.2.3.2 Patent Publication Growth Trend ....................................................................... 41 1.2.3.3 Patent Analysis by Country/Cluster ................................................................... 41 1.2.4Product Benchmarking ............................................................................... 42 1.3 Impact of COVID-19 ......................................................................................... 43 1.3.1Impact on Facilities ..................................................................................... 43 1.3.2Impact on Device Adoption ........................................................................ 44 1.3.3Impact on Market Size ................................................................................. 44 1.3.3.1 Pre-COVID-19 Phase ........................................................................................ 44 1.3.3.2 During COVID-19 Phase ................................................................................... 45 1.3.3.3 Post-COVID-19 Phase ....................................................................................... 45 1.4 Business Dynamics ......................................................................................... 46 3
1.4.1Impact Analysis ........................................................................................... 46 1.4.2Business Drivers ......................................................................................... 46 1.4.2.1 Rising Prevalence of Neurological Disorders and Traumatic Brain Injuries (TBI) ................................................................................................................... 46 1.4.2.2 Technological Advancements in the Brain Imaging Modalities and Systems ............................................................................................................. 48 1.4.2.3 Growing Popularity of Molecular Imaging in Brain Imaging ............................... 50 1.4.3Business Restraints .................................................................................... 51 1.4.3.1 Hospital Budget Cuts and High Upfront Cost .................................................... 51 1.4.3.2 Declining Helium Availability .............................................................................. 52 1.4.4Business Opportunities .............................................................................. 53 1.4.4.1 Integration of Imaging Systems and Software with Novel Biomarkers .............. 53 2. Application ........................................................................................... 54 2.1 Global Brain Imaging Modalities Market (by Patient Type) .......................... 55 2.1.1Opportunity Assessment ............................................................................ 55 2.1.2Growth-Share Matrix ................................................................................... 56 2.1.3Adults ........................................................................................................... 57 2.1.3.1 Market Trends .................................................................................................... 57 2.1.3.2 Market Size and Forecast .................................................................................. 58 2.1.4Pediatrics and Infants ................................................................................. 58 2.1.4.1 Market Trends .................................................................................................... 59 2.1.4.2 Market Size and Forecast .................................................................................. 60 2.2 Global Brain Imaging Modalities Market (by End User) ............................... 60 2.2.1Opportunity Assessment ............................................................................ 60 2.2.2Growth-Share Matrix ................................................................................... 61 2.2.3Hospitals and Clinics .................................................................................. 62 2.2.4Diagnostic Imaging Centers ....................................................................... 63 2.2.5Ambulatory Surgical Centers ..................................................................... 64 Product ................................................................................................. 66 3. 3.1 Global Brain Imaging Modalities Market (by Product) .................................. 67 3.1.1Opportunity Assessment ............................................................................ 67 4
3.1.2Market Share Analysis ................................................................................ 68 3.1.3Growth-Share Matrix ................................................................................... 69 3.1.3.1 Competitive Benchmarking ................................................................................ 70 3.1.4CT Devices ................................................................................................... 70 3.1.4.1 Current Market Scenario, Key Findings ............................................................. 71 3.1.4.2 Key Trends ........................................................................................................ 72 3.1.4.3 Production Volume ............................................................................................ 72 3.1.4.3.1North America .......................................................................................................... 73 3.1.4.3.2Europe ...................................................................................................................... 73 3.1.4.3.3Asia-Pacific .............................................................................................................. 73 3.1.4.3.4Rest-of-the-World ..................................................................................................... 73 3.1.4.4 Market Size and Forecast .................................................................................. 73 3.1.4.5 Vendor Analysis ................................................................................................. 74 3.1.4.5.1Market Share (by Vendor) ........................................................................................ 74 3.1.4.5.2Production Volume (by Vendor) ............................................................................... 75 3.1.5MRI Devices ................................................................................................. 75 3.1.5.1 Current Market Scenario (Key Findings) ........................................................... 75 3.1.5.2 Key Trends ........................................................................................................ 76 3.1.5.3 Production Volume ............................................................................................ 77 3.1.5.3.1North America .......................................................................................................... 77 3.1.5.3.2Europe ...................................................................................................................... 78 3.1.5.3.3Asia-Pacific .............................................................................................................. 78 3.1.5.3.4Rest-of-the-World ..................................................................................................... 78 3.1.5.4 Market Size and Forecast .................................................................................. 78 3.1.5.5 2D and 3D MRI Ratio ......................................................................................... 79 3.1.5.5.1U.S. .......................................................................................................................... 79 3.1.5.5.2EU5 .......................................................................................................................... 79 3.1.5.5.3Japan ....................................................................................................................... 79 3.1.5.5.4South Korea ............................................................................................................. 80 3.1.5.6 Vendor Analysis ................................................................................................. 80 5
3.1.5.6.1Market Share (by Vendor) ........................................................................................ 80 3.1.5.6.2Production Volume (by Vendor) ............................................................................... 80 3.1.6PET Devices ................................................................................................. 81 3.1.6.1 Current Market Scenario, Key Findings ............................................................. 81 3.1.6.2 Key Trends ........................................................................................................ 82 3.1.6.3 Production Volume ............................................................................................ 82 3.1.6.3.1North America .......................................................................................................... 83 3.1.6.3.2Europe ...................................................................................................................... 83 3.1.6.3.3Asia-Pacific .............................................................................................................. 83 3.1.6.3.4Rest-of-the-World ..................................................................................................... 83 3.1.6.4 Market Size and Forecast .................................................................................. 83 3.1.6.1 Vendor Analysis ................................................................................................. 84 3.1.6.1.1Market Share (by Vendor) ........................................................................................ 84 3.1.6.1.2Production Volume (by Vendor) ............................................................................... 85 3.1.7PET-CT Devices ........................................................................................... 85 3.1.7.1 Current Market Scenario, Key Findings ............................................................. 85 3.1.7.2 Key Trends ........................................................................................................ 86 3.1.7.3 Production Volume ............................................................................................ 87 3.1.7.3.1North America .......................................................................................................... 87 3.1.7.3.2Europe ...................................................................................................................... 87 3.1.7.3.3Asia-Pacific .............................................................................................................. 87 3.1.7.3.4Rest-of-the-World ..................................................................................................... 87 3.1.7.4 Market Size and Forecast .................................................................................. 88 3.1.7.5 Vendor Analysis ................................................................................................. 88 3.1.7.5.1Market Share (by Vendor) ........................................................................................ 88 3.1.7.5.2Production Volume (by Vendor) ............................................................................... 89 3.1.8PET-MRI Devices ......................................................................................... 89 3.1.8.1 Current Market Scenario, Key Findings ............................................................. 89 3.1.8.2 Key Trends ........................................................................................................ 90 3.1.8.3 Production Volume ............................................................................................ 91 6
3.1.8.3.1North America .......................................................................................................... 91 3.1.8.3.2Europe ...................................................................................................................... 91 3.1.8.3.3Asia-Pacific .............................................................................................................. 91 3.1.8.3.4Rest-of-the-World ..................................................................................................... 91 3.1.8.4 Market Size and Forecast .................................................................................. 92 3.1.8.5 Vendor Analysis ................................................................................................. 92 3.1.8.5.1Market Share (by Vendor) ........................................................................................ 92 3.1.8.5.2Production Volume (by Vendor) ............................................................................... 93 4. Region .................................................................................................. 94 4.1 North America Brain Imaging Modalities Market .......................................... 97 4.1.1Regulatory Framework ................................................................................ 97 4.1.2Market ........................................................................................................... 98 4.1.2.1 Key Findings and Opportunity Assessment ....................................................... 98 4.1.2.2 Market Dynamics ............................................................................................... 99 4.1.2.2.1Impact Analysis ........................................................................................................ 99 4.1.2.3 Sizing and Forecast Analysis ............................................................................. 99 4.1.3Application ................................................................................................. 100 4.1.3.1 North America Brain Imaging Modalities Market (by Patient Type) ................. 100 4.1.3.2 North America Brain Imaging Modalities Market (by End User) ...................... 101 4.1.4Product ....................................................................................................... 101 4.1.4.1 North America Brain Imaging Modalities Market (by Product Type) ................ 101 4.1.5North America Brain Imaging Modalities Market (by Country) .............. 102 4.1.5.1 U.S. .................................................................................................................. 102 4.1.5.2 Canada ............................................................................................................ 103 4.2 Europe Brain Imaging Modalities Market..................................................... 105 4.2.1Regulatory Framework .............................................................................. 105 4.2.2Market ......................................................................................................... 106 4.2.2.1 Key Findings and Opportunity Assessment ..................................................... 106 4.2.2.2 Market Dynamics ............................................................................................. 107 4.2.2.2.1Impact Analysis ...................................................................................................... 107 7
4.2.2.3 Sizing and Forecast Analysis ........................................................................... 108 4.2.3Application ................................................................................................. 109 4.2.3.1 Europe Brain Imaging Modalities Market (by Patient Type) ............................ 109 4.2.3.2 Europe Brain Imaging Modalities Market (by End User) .................................. 110 4.2.4Product ....................................................................................................... 111 4.2.4.1 Europe Brain Imaging Modalities Market (by Product) .................................... 111 4.2.5Europe Brain Imaging Modalities Market (by Country) .......................... 111 4.2.5.1 Germany .......................................................................................................... 111 4.2.5.2 France .............................................................................................................. 112 4.2.5.3 U.K. .................................................................................................................. 113 4.2.5.4 Italy .................................................................................................................. 114 4.2.5.5 Spain ................................................................................................................ 115 4.2.5.6 Rest-of-Europe ................................................................................................ 116 4.3 Asia-Pacific Brain Imaging Modalities Market ............................................. 119 4.3.1Regulatory Framework .............................................................................. 119 4.3.2Market ......................................................................................................... 120 4.3.2.1 Key Findings and Opportunity Assessment ..................................................... 120 4.3.2.2 Market Dynamics ............................................................................................. 121 4.3.2.2.1Impact Analysis ...................................................................................................... 121 4.3.2.1 Sizing and Forecast Analysis ........................................................................... 122 4.3.3Application ................................................................................................. 123 4.3.3.1 Asia-Pacific Brain Imaging Modalities Market (by Patient Type) ..................... 123 4.3.3.2 Asia-Pacific Brain Imaging Modalities Market (by End User) .......................... 124 4.3.4Product ....................................................................................................... 125 4.3.4.1 Asia-Pacific Brain Imaging Modalities Market (by Product Type) .................... 125 4.3.5Asia-Pacific Brain Imaging Modalities Market (by Country) .................. 125 4.3.5.1 China ............................................................................................................... 125 4.3.5.2 Japan ............................................................................................................... 126 4.3.5.3 India ................................................................................................................. 127 4.3.5.4 South Korea ..................................................................................................... 128 8
4.3.5.5 Australia and New Zealand .............................................................................. 129 4.3.5.6 Rest-of-Asia-Pacific ......................................................................................... 130 4.4 Rest-of-the-World Brain Imaging Modalities Market ................................... 133 4.4.1Regulatory Framework .............................................................................. 133 4.4.2Market ......................................................................................................... 134 4.4.2.1 Key Findings and Opportunity Assessment ..................................................... 134 4.4.2.2 Market Dynamics ............................................................................................. 135 4.4.2.2.1Impact Analysis ...................................................................................................... 135 4.4.2.3 Sizing and Forecast Analysis ........................................................................... 135 4.4.3Application ................................................................................................. 136 4.4.3.1 Rest-of-the-World Brain Imaging Modalities Market (by Patient Type) ............ 136 4.4.3.2 Rest-of-the-World Brain Imaging Modalities Market (by End User) ................. 137 4.4.4Product ....................................................................................................... 138 4.4.4.1 Rest-of-the-World Brain Imaging Modalities Market (by Product Type) .......... 138 4.4.5Rest-of-the-World Brain Imaging Modalities Market (by Country) ........ 138 4.4.5.1 Latin America ................................................................................................... 138 4.4.5.2 Middle East and Africa ..................................................................................... 139 5. Market- Company Profiles and Competitive Benchmarking ......... 142 5.1 Competitive Landscape ................................................................................ 143 5.1.1Key Strategies and Developments ........................................................... 143 5.1.1.1 Regulatory and Legal Activities ....................................................................... 144 5.1.1.2 New Product Offerings and Upgradations ....................................................... 145 5.1.1.3 Partnerships, Alliances, and Business Expansion ........................................... 145 5.1.1.4 Funding Activities ............................................................................................. 146 5.1.1.5 Mergers and Acquisitions ................................................................................ 146 5.2 Market Share Analysis .................................................................................. 147 5.3 Company Profiles .......................................................................................... 149 5.3.1Aspect Imaging .......................................................................................... 149 5.3.1.1 Company Overview ......................................................................................... 149 5.3.1.2 Role of Aspect Imaging in the Global Brain Imaging Modalities Market .......... 149 9
5.3.1.3 Product Portfolio and Offerings ........................................................................ 149 5.3.1.4 Aspect Imaging: SWOT Analysis ..................................................................... 150 5.3.2Canon, Inc. ................................................................................................. 151 5.3.2.1 Company Overview ......................................................................................... 151 5.3.2.2 Role of Canon, Inc. in the Global Brain Imaging Modalities Market ................ 151 5.3.2.3 Product Portfolio and Offerings ........................................................................ 152 5.3.2.4 Recent Developments ..................................................................................... 153 5.3.2.5 Financials ......................................................................................................... 153 5.3.2.6 Canon, Inc.: SWOT Analysis ........................................................................... 156 5.3.3Esaote SpA ................................................................................................ 158 5.3.3.1 Company Overview ......................................................................................... 158 5.3.3.2 Role of Esaote SpA in the Global Brain Imaging Modalities Market ................ 158 5.3.3.3 Product Portfolio and Offerings ........................................................................ 158 5.3.3.4 Esaote SpA: SWOT Analysis ........................................................................... 159 5.3.4Fujifilm Holdings Corporation .................................................................. 160 5.3.4.1 Company Overview ......................................................................................... 160 5.3.4.2 Role of Fujifilm Holdings Corporation in the Global Brain Imaging Modalities Market ............................................................................................. 160 5.3.4.3 Product Portfolio and Offerings ........................................................................ 161 5.3.4.4 Financials ......................................................................................................... 162 5.3.4.5 Recent Developments ..................................................................................... 164 5.3.4.6 Fujifilm Holdings Corporation: SWOT Analysis ............................................... 164 5.3.5General Electric Company ........................................................................ 166 5.3.5.1 Company Overview ......................................................................................... 166 5.3.5.2 Role of General Electric Company in the Global Brain Imaging Modalities Market .............................................................................................................. 166 5.3.5.3 Product Portfolio and Offerings ........................................................................ 167 5.3.5.4 Financials ......................................................................................................... 168 5.3.5.5 General Electric Company: SWOT Analysis .................................................... 171 5.3.6Hyperfine Inc. ............................................................................................. 172 5.3.6.1 Company Overview ......................................................................................... 172 10
5.3.6.2 Role of Hyperfine Inc. in the Global Brain Imaging Modalities Market ............. 172 5.3.6.3 Product Portfolio and Offerings ........................................................................ 172 5.3.6.4 Recent Developments ..................................................................................... 172 5.3.6.5 Hyperfine Inc.: SWOT Analysis ....................................................................... 173 5.3.7Koninklijke Philips N.V. ............................................................................. 174 5.3.7.1 Company Overview ......................................................................................... 174 5.3.7.2 Role of Koninklijke Philips N.V. in the Global Brain Imaging Modalities Market .............................................................................................................. 174 5.3.7.3 Product Portfolio and Offerings ........................................................................ 175 5.3.7.4 Financials ......................................................................................................... 176 5.3.7.5 Koninklijke Philips N.V.: SWOT Analysis ......................................................... 178 5.3.8Mediso Medical Imaging Systems ............................................................ 180 5.3.8.1 Company Overview ......................................................................................... 180 5.3.8.2 Role of Mediso Medical Imaging Systems in the Global Brain Imaging Modalities Market ............................................................................................. 180 5.3.8.3 Product Portfolio and Offerings ........................................................................ 180 5.3.8.4 Mediso Medical Imaging Systems: SWOT Analysis ........................................ 181 5.3.9MinFound Medical Systems Co., Ltd. ...................................................... 182 5.3.9.1 Company Overview ......................................................................................... 182 5.3.9.2 Role of MinFound Medical Systems Co., Ltd. in the Global Brain Imaging Modalities Market ............................................................................................. 182 5.3.9.3 Product Portfolio and Offerings ........................................................................ 183 5.3.9.4 MinFound Medical Systems Co., Ltd.: SWOT Analysis ................................... 183 5.3.10Samsung Electronics Co., Ltd. ................................................................. 185 5.3.10.1 Company Overview ......................................................................................... 185 5.3.10.2 Role of Samsung Electronics Co., Ltd. in the Global Brain Imaging Modalities Market ............................................................................................. 185 5.3.10.3 Product Portfolio and Offerings ........................................................................ 186 5.3.10.4 Financials ......................................................................................................... 186 5.3.10.5 Samsung Electronics Co., Ltd.: SWOT Analysis ............................................. 189 5.3.11Shenzhen Anke High-Tech Co.,Ltd. ......................................................... 191 11
5.3.11.1 Company Overview ......................................................................................... 191 5.3.11.2 Role of Shenzhen Anke High-Tech Co., Ltd. in the Global Brain Imaging Modalities Market ............................................................................................. 191 5.3.11.3 Product Portfolio and Offerings ........................................................................ 191 5.3.11.4 Shenzhen Anke High-Tech Co., Ltd.: SWOT Analysis .................................... 192 5.3.12Shimadzu Corporation .............................................................................. 193 5.3.12.1 Company Overview ......................................................................................... 193 5.3.12.2 Role of Shimadzu Corporation in the Global Brain Imaging Modalities Market .............................................................................................................. 193 5.3.12.3 Product Portfolio and Offerings ........................................................................ 194 5.3.12.4 Financials ......................................................................................................... 194 5.3.12.5 Recent Developments ..................................................................................... 197 5.3.12.6 Shimadzu Corporation: SWOT Analysis .......................................................... 197 5.3.13Siemens Healthineers AG ......................................................................... 198 5.3.13.1 Company Overview ......................................................................................... 198 5.3.13.2 Role of Siemens Healthineers AG in the Global Brain Imaging Modalities Market .............................................................................................................. 198 5.3.13.3 Product Portfolio and Offerings ........................................................................ 199 5.3.13.4 Financials ......................................................................................................... 200 5.3.13.5 Recent Developments ..................................................................................... 202 5.3.13.6 Siemens Healthineers AG: SWOT Analysis .................................................... 203 5.3.14United Imaging Healthcare Co., Ltd. ........................................................ 204 5.3.14.1 Company Overview ......................................................................................... 204 5.3.14.2 Role of United Imaging Healthcare Co., Ltd. in the Global Brain Imaging Modalities Market ............................................................................................. 204 5.3.14.3 Product Portfolio and Offerings ........................................................................ 205 5.3.14.4 Recent Developments ..................................................................................... 206 5.3.14.5 United Imaging Healthcare Co., Ltd.: SWOT Analysis .................................... 206 5.3.15VUNO Co., Ltd. ........................................................................................... 207 5.3.15.1 Company Overview ......................................................................................... 207 5.3.15.2 Role of VUNO Co., Ltd. in the Global Brain Imaging Modalities Market .......... 207 12
5.3.15.3 Product Portfolio and Offerings ........................................................................ 207 5.3.15.4 Recent Developments ..................................................................................... 208 5.3.15.5 VUNO Co., Ltd.: SWOT Analysis ..................................................................... 208 6. Research Methodology ..................................................................... 209 6.1 Data Collection and Analysis ........................................................................ 209 6.2 Data Sources .................................................................................................. 209 6.2.1Primary Data Sources ............................................................................... 209 6.2.2Secondary Data Sources .......................................................................... 210 6.3 Data Triangulation ......................................................................................... 212 6.4 Market Estimation .......................................................................................... 213 6.5 Forecast Period Selection Criteria ............................................................... 214 6.6 Assumptions and Limitations ....................................................................... 214 13
List of Figures Figure 1: Global Brain Imaging Modalities Market, Impact Analysis Figure 2: Global Brain Imaging Modalities Market Potential, $Million, 2020, 2024, 2027, and 2031 Figure 3: Global Brain Imaging Modalities Market (by Product Type) Figure 4: Global Brain Imaging Modalities Market (by End User) Figure 5: Key Developments and Strategies, January 2017-December 2021 Figure 6: Global Brain Imaging Modalities Market Growth-Share Matrix, 2021-2031 Figure 7: Global Brain Imaging Modalities Coverage Figure 8: Global Brain Imaging Modalities Market, Realistic Growth Scenario, $Million, 2020-2031 Figure 9: Global Brain Imaging Modalities Market, Optimistic Growth Scenario, $Million, 2020-2031 Figure 10: Global Brain Imaging Modalities Market, Pessimistic Growth Scenario, $Million, 2020-2031 Figure 11: Global Brain Imaging Modalities Market, Short-Term Potential, $Million, 2022-2025 Figure 12: Global Brain Imaging Modalities Market, Long-Term Growth, $Million, 2026-2031 Figure 13: Global Brain Imaging Modalities Market, Patent Publication Growth Trend, January 2018- December 2021 Figure 14: Global Brain Imaging Modalities Market, Patent Filing Trend (by Country/Cluster), January 2018-December 2021 Figure 15: Pre-COVID-19 Scenario, Global Brain Imaging Modalities Market Figure 16: Global Brain Imaging Modalities Market, Impact Analysis Figure 17: Technological Advancements in Brain Imaging Figure 18: Molecular Imaging Techniques: General Characteristics Figure 19: Global Brain Imaging Modalities Market (by Patient Type) Figure 20: Global Brain Imaging Modalities Market Incremental Opportunity (by Patient Type), $Million, 2022-2031 Figure 21: Global Brain Imaging Modalities Market, Growth-Share Matrix (by Patient Type), 2020-2031 Figure 22: Global Brain Imaging Modalities Market (by Adults), $Million, 2020-2031 Figure 23: Global Brain Imaging Modalities Market (by Pediatrics and Infants), $Million, 2020-2031 Figure 24: Global Brain Imaging Modalities Market (by End User) Figure 25: Global Brain Imaging Modalities Market Incremental Opportunity (by End User), $Million, 2022-2031 Figure 26: Global Brain Imaging Modalities Market, Growth-Share Matrix (by End User), 2020-2031 Figure 27: Global Brain Imaging Modalities Market (by Hospitals and Clinics), $Million, 2020-2031 Figure 28: Global Brain Imaging Modalities Market (by Diagnostic Imaging Centers), $Million, 2020-2031 14
Figure 29: Global Brain Imaging Modalities Market (by Ambulatory Surgical Centers), $Million, 2020- 2031 Figure 30: Global Brain Imaging Modalities Market (by Product Type) Figure 31: Global Brain Imaging Modalities Market Incremental Opportunity (by Product Type), $Million, 2022-2031 Figure 32: Market Share by Product Type, 2021 Figure 33: Global Brain Imaging Modalities Market, Growth-Share Matrix (by Product Type), 2020-2031 Figure 34: Global Brain Imaging Market Competitive Benchmarking (by Key Players) Figure 35: Global Brain Imaging Modalities Incremental Opportunity Analysis (CT Devices), 2022-2031 Figure 36: CT Devices, Key Trends Figure 37: Global Brain Imaging Modalities Market (by CT Devices), $Million, 2020-2031 Figure 38: CT Devices, Market Share (by Vendor), 2021 Figure 39: Global Brain Imaging Modalities Incremental Opportunity Analysis (CT Devices), 2022-2031 Figure 40: MRI Devices, Key Trends Figure 41: Global Brain Imaging Modalities Market (by MRI Devices), $Million, 2020-2031 Figure 42: 2D and 3D MRI Ratio Figure 43: MRI Devices, Market Share (by Vendor), 2021 Figure 44: Global Brain Imaging Modalities Incremental Opportunity Analysis (PET Devices), 2022-2031 Figure 45: PET Devices, Key Trends Figure 46: Global Brain Imaging Modalities Market (by PET Devices), $Million, 2020-2031 Figure 47: PET Devices, Market Share Analysis (by Vendor), 2021 Figure 48: Global Brain Imaging Modalities Incremental Opportunity Analysis (PET-CT Devices), 2022- 2031 Figure 49: PET-CT Devices, Key Trends Figure 50: Global Brain Imaging Modalities Market (by PET-CT Devices), $Million, 2020-2031 Figure 51: PET-CT Devices, Market Share (by Vendor), 2021 Figure 52: Global Brain Imaging Modalities Incremental Opportunity Analysis (PET-MRI Devices), 2022- 2031 Figure 53: PET-MRI Devices, Key Trends Figure 54: Global Brain Imaging Modalities Market (PET-MRI Devices), $Million, 2020-2031 Figure 55: PET-MRI Devices, Market Share Analysis (by Vendor), 2021 Figure 56: Global Brain Imaging Modalities Market (by Region), 2021 and 2031 Figure 57: North America Brain Imaging Modalities Market Incremental Growth Opportunity (by Country), $Million, 2022-2031 15
Figure 58: North America Brain Imaging Modalities Market, $Million, 2020-2031 Figure 59: North America Brain Imaging Modalities Market (by Patient Type), $Million, 2020-2031 Figure 60: North America Brain Imaging Modalities Market (by End User), $Million, 2020-2031 Figure 61: North America Brain Imaging Modalities Market (by Product Type), $Million, 2020-2031 Figure 62: U.S. Brain Imaging Modalities Market, $Million, 2020-2031 Figure 63: Canada Brain Imaging Modalities Market, $Million, 2020-2031 Figure 64: Europe Brain Imaging Modalities Market Incremental Growth Opportunity, $Million, 2022- 2031 Figure 65: Europe Brain Imaging Modalities Market, $Million, 2020-2031 Figure 66: Europe Brain Imaging Modalities Market (by Patient Type), $Million, 2020-2031 Figure 67: Europe Brain Imaging Modalities Market (by End User), $Million, 2020-2031 Figure 68: Europe Brain Imaging Modalities Market (by Product), $Million, 2020-2031 Figure 69: Germany Brain Imaging Modalities Market, $Million, 2020-2031 Figure 70: France Brain Imaging Modalities Market, $Million, 2020-2031 Figure 71: U.K. Brain Imaging Modalities Market, $Million, 2020-2031 Figure 72: Italy Brain Imaging Modalities Market, $Million, 2020-2031 Figure 73: Spain Brain Imaging Modalities Market, $Million, 2020-2031 Figure 74: Rest-of-Europe Brain Imaging Modalities Market, $Million, 2020-2031 Figure 75: Asia-Pacific Brain Imaging Modalities Market Incremental Growth Opportunity, $Million, 2022- 2031 Figure 76: Asia-Pacific Brain Imaging Modalities Market, $Million, 2020-2031 Figure 77: Asia-Pacific Brain Imaging Modalities Market (by Patient Type), $Million, 2020-2031 Figure 78: Asia-Pacific Brain Imaging Modalities Market (by End User), $Million, 2020-2031 Figure 79: Asia-Pacific Brain Imaging Modalities Market (by Product Type), $Million, 2020-2031 Figure 80: China Brain Imaging Modalities Market, $Million, 2020-2031 Figure 81: Japan Brain Imaging Modalities Market, $Million, 2020-2031 Figure 82: India Brain Imaging Modalities Market, $Million, 2020-2031 Figure 83: South Korea Brain Imaging Modalities Market, $Million, 2020-2031 Figure 84: Australia and New Zealand Brain Imaging Modalities Market, $Million, 2020-2031 Figure 85: Rest-of-Asia-Pacific Brain Imaging Modalities Market, $Million, 2020-2031 Figure 86: Rest-of-the-World Brain Imaging Modalities Market Incremental Growth Opportunity, $Million, 2022-2031 Figure 87: Rest-of-the-World Brain Imaging Modalities Market, $Million, 2020-2031 16
Figure 88: Rest-of-the-World Brain Imaging Modalities Market (by Patient Type), $Million, 2020-2031 Figure 89: Rest-of-the-World Brain Imaging Modalities Market (by End User), $Million, 2020-2031 Figure 90: Rest-of-the-World Brain Imaging Modalities Market (by Product Type), $Million, 2020-2031 Figure 91: Latin America Brain Imaging Modalities Market, $Million, 2020-2031 Figure 92: Middle East and Africa Brain Imaging Modalities Market, $Million, 2020-2031 Figure 93: Share of Key Developments and Strategies, January 2017-December 2021 Figure 94: Regulatory and Legal Activities Share (by Company), January 2017-December 2021 Figure 95: New Product Offerings and Upgradations Share (by Company), January 2017-December 2021 Figure 96: Partnerships, Alliances, and Business Expansion Share (by Company), January 2017- December 2021 Figure 97: Mergers and Acquisitions Share (by Company), January 2017-December 2021 Figure 98: Market Share Analysis (by Company), 2021 Figure 99: Aspect Imaging: Product Offerings Figure 100: Canon, Inc.: Product Offerings Figure 101: Canon, Inc.: Overall Financials, $Million, 2018-2020 Figure 102: Canon, Inc.: Net Revenue (by Segment), $Million, 2018-2020 Figure 103: Canon, Inc.: Revenue (by Region), $Million, 2018-2020 Figure 104: Canon, Inc.: R&D Expenditure, $Million, 2018-2020 Figure 105: Esaote SpA: Product Offerings Figure 106: Fujifilm Holdings Corporation: Product Offerings Figure 107: Fujifilm Holdings Corporation: Overall Financials, $Million, 2018-2020 Figure 108: Fujifilm Holdings Corporation: Net Revenue (by Segment), $Million, 2018-2020 Figure 109: Fujifilm Holdings Corporation: Net Revenue (by Region), $Million, 2018-2020 Figure 110: Fujifilm Holdings Corporation: R&D Expenditure, $Million, 2018-2020 Figure 111: General Electric Company: Product Offerings Figure 112: General Electric Company.: Overall Financials, $Million, 2018-2020 Figure 113: General Electric Company: Net Revenue (by Segment), $Million, 2018-2020 Figure 114: General Electric Company: Net Revenue (by Region), $Million, 2018-2020 Figure 115: General Electric Company: R&D Expenditure, $Million, 2018-2020 Figure 116: Hyperfine Inc.: Product Offerings Figure 117: Koninklijke Philips N.V.: Product Offerings Figure 118: Koninklijke Philips N.V.: Overall Financials, $Million, 2018-2020 17
Figure 119: Koninklijke Philips N.V.: Net Revenue (by Segment), $Million, 2018-2020 Figure 120: Koninklijke Philips N.V.: Net Revenue (by Region), $Million, 2018-2020 Figure 121: Koninklijke Philips N.V.: R&D Expenditure, $Million, 2018-2020 Figure 122: Mediso Medical Imaging Systems: Product Offerings Figure 123: MinFound Medical Systems Co., Ltd.: Product Offerings Figure 124: Samsung Electronics Co., Ltd.: Product Offerings Figure 125: Samsung Electronics Co., Ltd.: Overall Financials, $Million, 2018-2020 Figure 126: Samsung Electronics Co., Ltd.: Net Revenue (by Segment), $Million, 2018-2020 Figure 127: Samsung Electronics Co., Ltd.: Net Revenue (by Region), $Million, 2018-2020 Figure 128: Samsung Electronics Co., Ltd.: R&D Expenditure, $Million, 2018-2020 Figure 129: Shenzhen Anke High-Tech Co., Ltd.: Product Offerings Figure 130: Shimadzu Corporation: Product Offerings Figure 131: Shimadzu Corporation: Overall Financials, $Million, 2018-2020 Figure 132: Shimadzu Corporation: Net Revenue (by Segment), $Million, 2018-2020 Figure 133: Shimadzu Corporation: Net Revenue (by Region), $Million, 2018-2020 Figure 134: Shimadzu Corporation: R&D Expenditure, $Million, 2018-2020 Figure 135: Siemens Healthineers AG: Product Offerings Figure 136: Siemens Healthineers AG: Overall Financials, $Million, 2019-2021 Figure 137: Siemens Healthineers AG: Net Revenue (by Segment), $Million, 2019-2021 Figure 138: Siemens Healthineers AG: Net Revenue (by Region), $Million, 2019-2021 Figure 139: Siemens Healthineers AG: R&D Expenditure, $Million, 2019-2021 Figure 140: United Imaging Healthcare Co., Ltd.: Product Offerings Figure 141: VUNO Co., Ltd.: Product Offerings Figure 142: Global Brain Imaging Modalities Market: Research Methodology Figure 143: Primary Research Figure 144: Secondary Research Figure 145: Data Triangulation Figure 146: Global Brain Imaging Modalities Market Research Process Figure 147: Assumptions and Limitations 18
List of Tables Table 1: Challenges in the Global Brain Imaging Modalities Market Table 2: Global Brain Imaging Modalities Market, Key Trends Table 3: Global Brain Imaging Modalities Market, Awaited Technology Developments Table 4: Global Brain Imaging Modalities Market, Product Benchmarking Table 5: Global Brain Imaging Modalities Market, Key Trends (by Adults) Table 6: Global Brain Imaging Modalities Market, Key Trends (by Pediatrics and Infants) Table 7: CT Devices, Production Volume (by Region) Table 8: CT Devices, Production Volume (by Vendor) Table 9: MRI Devices, Production Volume (by Region) Table 10: MRI Devices, Production Volume (by Vendor) Table 11: PET Devices, Production Volume (by Region) Table 12: PET Devices, Production Volume (by Vendor) Table 13: PET-CT Devices, Production Volume (by Region) Table 14: PET-CT Devices, Production Volume (by Vendor) Table 15: PET-MRI Devices, Production Volume (by Region) Table 16: PET-MRI Devices, Production Volume (by Vendor) Table 17: North America Brain Imaging Modalities Market, Regulatory Framework Table 18: North America Brain Imaging Modalities Market, Impact Analysis Table 19: Europe Brain Imaging Modalities Market Regulations Table 20: Challenges in MDR Implementation Table 21: Europe Brain Imaging Modalities, Impact Analysis Table 22: Asia-Pacific Brain Imaging Modalities Market Regulations Table 23: Asia-Pacific Brain Imaging Modalities Market, Impact Analysis Table 24: Rest-of-the-World Brain Imaging Modalities Market Regulatory Framework Table 25: Rest-of-the-World Brain Imaging Modalities Market, Impact Analysis Table 26: Funding Activities, January 2017-December 2021 Table 27: Secondary Data Sources 19
BIS Research Offerings: We are on a mission to harness the potential of disruptive technologies to make businesses thrive in today’s digital age. We have a vision to be a leading and a preferred knowledge partner for corporates and institutions worldwide and assist them with market intelligence in the area of emerging technologies, advisories, and other innovative solutions. Know More Know More Know More Know More 20
Disclaimer BIS Research Inc. provides valuable market intelligence to an exclusive group of customers in response to orders. The report is licensed for the customer's internal use only and is subject to restrictions set henceforth. This document and its contents are confidential and may not be further distributed, published, or reproduced, in whole or in part, by any medium or in any form for any purpose, without the express written consent of BIS Research Inc. Customer will not disclose the contents of the report, whether directly in any media or indirectly through incorporation in a database, marketing list, report or otherwise, or use or permit the use of Information to generate any statistical or other information that is or will be provided to third parties; or voluntarily produce Information in legal proceedings. Market reports are based on expectations, estimates, and projections as of the date such information is available. Any recommendation contained in this report may not be suitable for all investors or businesses. The market conclusions drawn are necessarily based upon a number of estimates and assumptions that, while considered reasonable by BIS Research Inc. as of the date of such statements, are inherently subject to market fluctuations and business, economic and competitive uncertainties, and contingencies For more details regarding permission, please contact us: Email: sales@bisresearch.com Tel: +1 510 404 8135 21
BIS RESEARCH INC. 39111 Paseo Padre PKWY, Suite 313 Fremont, CA 94538 -1686 E-mail: hello@bisresearch.com | Call Us: +1-510-404-8135 Global Delivery Center Tower B First Floor, Tapasya Corporate Heights, Greater Noida Expressway, Sector 126, Noida, U.P., 201303, India BIS RESEARCH INC. Tel: +91 120 4261540 / 4261544 39111 Paseo Padre PKWY, Suite 313 Fremont, CA 94538 -1686 E-mail: hello@bisresearch.com | Call Us: +1-510-404-8135 www.bisresearch.com 22 Global Delivery Center