Download
1 / 28
280 likes | 454 Vues
Dive into the world of technical analysis and stock market trends with insightful chart reading techniques. Learn about candlestick charts, moving averages, and indicators like RSI and MACD to make informed investment decisions for the future.

E N D
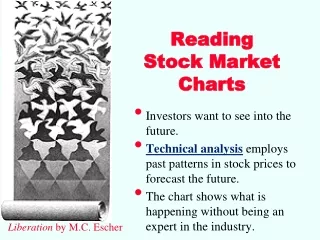
Reading Stock Market Charts • Investors want to see into the future. • Technical analysis employs past patterns in stock prices to forecast the future. • The chart shows what is happening without being an expert in the industry. Liberation by M.C. Escher
The Future Beliefs About the Future • Forecasting rests on animplicit beliefthat past relationships will continue into the future. • Natura non facit saltum– Nature never moves in leaps by Alfred Marshall, 1890, Principles of Economics, front piece motto. • If the world changes too quickly, no model will be useful. The Present
Reading Daily Stock Charts • Open-High-Low-Close appear in bar charts. • Charts show volatility and how the stock performed over the day in summary fashion. • Volume also shows activity on the bottom. Plain Vanilla Charts
Candlestick Charts • The wick represents the high and the low • The bar (candle) shows the open and close • An empty barshows a rising price from open to close • The filled barshows a declining price • Candles call attention to up and down moves Closed and Open Candlesticks
Trendlines and Channels Market Wisdom revealed in pithy sayings: • The trend is your friend • Don’t fight the ticker • Don’t stand in front of a runaway train • Go with the flow • Don’t swim upstream • They demonstrate wisdom that the market sometimes has updrafts and downdrafts The trend is definitely upward
Downtrends Occur • The trick is to know when the trend is down and when it is up. • Selling at the top is hard to do. • But hanging on to a loser is unprofitable. Downward Channel Lines
Dow Theory, Head & Shoulders & Confirmation Cumulative Volume Indices Short Ratio Number of New Highs or New Lows Moving Average Convergence-Divergence Analysis (MACD) Ten Common Technical Tools • Trends, Channels, Bollinger Bands • Moving Averages • Relative Strength Indicators • Advance/Decline Ratio • Elliott Waves Dick’s Favorite
1. Bollinger Bands & 2. Simple Moving Averages • In the 1980s, John Bollinger, developed the technique of using a moving average with two trading bands using standard deviations.
2. How to do Moving Averages (MA) andExponential Moving Averages (EMA) • MA(current) = { Price(past1) + Price(past2) + … Price(pastN) } / N • EMA(current) = ( (Price(current) - EMA(prev) ) x Multiplier) + EMA(prev) where the Multiplier = 2 / (N + 1) and N in the time period is the fixed period one • Percentage EMAuses a set percentage multiplier and the above equation. • In EVA (3), multiplier is 2/(3+1) or .5 and the FORMULA: EMA(current) = ( (Price(current) – EMA(prev) ) x Multiplier) + EMA(prev) • Ex: EVA at period 3 is (29.22 – 22.94)(.5)+ 22.94 = 26.08 in oval using fixed period of 3 example.
Graphing SMOOTHING by MOVING AVERAGE & EXPONENTIAL MOVING AVERAGE EMA (in yellow) is subject to quicker turnsthan a simple MA is.
Using 70 day EMA • If buy when price is above 70 day EMA and sell when below, then sell in mid MAY, buy back again in mid October, and sell again in the later period. SELL BUY SELL
3. Relative Strength & RS Index March 2, 2017 RSI = 93. Says we are overbought. • RS can be just the ratio of 2 stock prices, say Ford/GM and how they move. • The RSI oscillates between zero and 100. RSI = 100 – [100 / ( 1 + (Average of Upward Price Changes / Average of Downward Price Changes ) ) ] (can be daily, weekly, monthly, etc.) • SI is considered overbought when above 70 and oversold when below 30. https://www.marketvolume.com/stocks/relativestrengthindexrsi.asp?s=SPY&t=spdr-s-p-500
3. Advance/Decline Ratio • A market-breadth indicator compares the number of stocks that closed higher with the number of stocks that closed lower than their previous day's closing price. • The A/D ratio can be calculated for various time periods, such as one day, one week or one month.
4. Basics of Elliott Waves • Market cycles are composed of two major types of waves • Impulse Waves • and CorrectiveWaves • Every impulse wave can be sub-divided into a five wave structure • Corrective waves can be sub-divided into three. Total waves = 8
Waves Within Waves • Elliott Waves are fractal in nature. • 'Fractal' means that they are built from similar patterns on both larger or smaller scales. • The waves appears in long-term yearly market charts as well as short-term hourly charts. Total number of waves = 34
Types of Impulse Waves • Extended first impulse, #1 • Extended second impulse • Extended third impulse • Extension means the wave is elongated in nature • Only one wave is an extension • Sometimes impulse waves collapse • But they follow rules , #2 (never the shortest) , #3 #1 #2 #3
5. Dow Theory & Confirmation Dow Theorylike Elliot Waves: Primary trends have three phases. A primary trend will pass through three phases. In a bull market, these are the (1) accumulation phase, (2) the public participation(or big move) phase and (3) the excess phase. In a bear market, they are called the distribution phase, the public participation phase and the panic(or despair) phase. • Under Dow theory, a major reversalfrom a bull to a bear market (or vice versa) cannot be signaled unless both indexes (traditionally the Dow Industrial and Transports or Rails) are in agreement. • Confirmation!
Head and Shoulders(not the shampoo!) • Head and shouldersformation occurs when a market trend is in the process of reversal either from a bullish or bearish trend; a characteristic pattern takes shape and is recognized as reversal formation.
7. Cumulative Volume Index (CVI) Subtract the total number of declining stocks from the number of advancing stocks. CVI or Cumulative Volume Index = Prior Day's CVI + (# of advancing stocks - # of declining stocks) A downward sloping CVI is bearish and an upward sloping CVI is bullish. • If someone wants to buy a lot of shares, volume rises. • If someone wants to sell a lot of shares, volume rises. • Volume matters! Both for a stock and the market.
8. The Short Ratio – a weak measure SPY • A Measure of Sentiment • Divide the amount of stocks shorted by the average daily volume for a stock. • Short sellers are potential buyers sooner or later and represent a lot of buying power when they have to scramble for cover in a sudden market turn. • Contrary indicators require at least some degree of pessimism in order to function and therefore you should be skeptical of this ratio. SRI If short interest is rising on a stock, it may offer a bunch of new buyers or maybe they know something.
9. New Highs & New Lows OEX in 2010 • Also a breath measure. • Record High Percent = {New Highs / (New Highs + New Lows)} x 100 • High-Low Index = 10-day SMA of Record High Percent • Declining Hi-Low index is a sell signal but a late signal.
10. Moving Average Convergence-Divergence(MACD) • MACD is an updated price momentum indicator (Gerald Appel) which includes a signal or trigger line. • It is a smoothed oscillator based on the point spread differencebetween two exponential moving averages, constructed as a (Short – Long) oscillators. • A 26 day EMA (long) & a 12 day EMA (short) • The difference (short - long)is MACD line • 9 day EMA to form the SIGNAL orTRIGGER line • Buy when MACD crosses Trigger Line • “You don’t have to understand the concept behind a technical indicator to use it; you just need to know what to ask the computer to do with it” -- Cyber-Investing, Brown & Bentley, 1995, p. 62
26 Day Long 12 DAY Short MACD (short-long) & Trigger As 9 day EMA Divergence= MACD-Trigger MACD crosses Trigger Lineis an early buy indicator
Two Moving Averages(for momentum price oscillators) • Short runmoving average emphasizes what is currently occurring • Someone could be accumulating shares and bidding the price up • Someone could be dumping shares to bring it down • A long runmoving average is the base line against what is happening generally • When the short run crosses the long run, we see momentum in the price (BUY).
A Price oscillatoris the difference between a short and long exponential moving average as a percent or as an amount For British pounds, I used 9-day and 25-day periods. The oscillator is positive when the 9-day is above the 25 day line When line goes above zero, buyas the 9 day is above the 25 day It is good in a trending market, but it whipsaws with too many trades in sideways markets Momentum Price Oscillator
SOX index 200 day MA SOX is the semi-conductor index.Top box: shows 200-day simple MA Bottom box: shows blue MACD line of 12 day EMA – 26 day EMA Red line is 9 day EMA of MACD which is a signal or trigger line. Divergence is the difference between MACD and its 9-day EMA. The histogram is positive when MACD is above its 9-day EMA; negative when MACD is below its 9-day EMA.
4 Traps of Technical Analysis • Most technical buy & sell indicators occur too late • Often the first few days of a market move includes 2/3rd of the total upward or downward correction. If missed, there is much less to be had. • Many technical indicators switch on and off too often, leading to excessive trading costs • Stop loss orders can leave you out of the stock, then buy it back, eating up profits. • Some technical indicators keep you out of the market for years • Hard to explain to clients if you keep them out of stocks for long, long periods. 4. Communists view of the failure of the USSR – “The Soviets just didn’t do it correctly.” All test failures are blamed on inexact methods rather than the technique.
Online Financial Data • Bloomberg https://www.bloomberg.com/markets • Value Line – sample http://www.valueline.com/dow30/index.aspx • Investor’s Business Daily – online http://www.investors.com/ • Financial Times – online http://www.ft.com/home/us • SEC Edgar – online http://www.sec.gov/edgar.shtml • St. Louis Federal Reserve FRED – online econ data http://research.stlouisfed.org/fred2/