Download
1 / 66
670 likes | 781 Vues
This presentation by David A. Patterson and Kimberly K. Keeton at UC Berkeley delves into the latest trends in hardware technologies affecting database opportunities. It reviews five key technologies: disk, network, memory, processor, and systems, detailing their histories, performance models, and state-of-the-art advancements. The discussion includes insights on how Moore's Law influences chip development, common challenges in technology convergence, and projected future capacities. Additionally, it highlights the critical performance metrics of latency and bandwidth important for database applications.

E N D
Hardware Technology Trends and Database Opportunities David A. Patterson and Kimberly K. Keeton http://cs.berkeley.edu/~patterson/talks {patterson,kkeeton}@cs.berkeley.edu EECS, University of California Berkeley, CA 94720-1776
Outline • Review of Five Technologies: Disk, Network, Memory, Processor, Systems • Description / History / Performance Model • State of the Art / Trends / Limits / Innovation • Following precedent: 2 Digressions • Common Themes across Technologies • Perform.: per access (latency) + per byte (bandwidth) • Fast: Capacity, BW, Cost; Slow: Latency, Interfaces • Moore’s Law affecting all chips in system • Technologies leading to Database Opportunity? • Hardware & Software Alternative to Today • Back-of-the-envelope comparison: scan, sort, hash-join
Disk Description / History Track Embed. Proc. (ECC, SCSI) Sector Track Buffer Arm Head Platter 1973: 1. 7 Mbit/sq. in 140 MBytes 1979: 7. 7 Mbit/sq. in 2,300 MBytes Cylinder source: New York Times, 2/23/98, page C3, “Makers of disk drives crowd even more data into even smaller spaces”
Disk History 1989: 63 Mbit/sq. in 60,000 MBytes 1997: 1450 Mbit/sq. in 2300 MBytes 1997: 3090 Mbit/sq. in 8100 MBytes source: New York Times, 2/23/98, page C3
Latency = Queuing Time + Controller time + Seek Time + Rotation Time + Size / Bandwidth { per access + per byte Performance Model /Trends • Capacity • + 60%/year (2X / 1.5 yrs) • Transfer rate (BW) • + 40%/year (2X / 2.0 yrs) • Rotation + Seek time • – 8%/ year (1/2 in 10 yrs) • MB/$ • > 60%/year (2X / <1.5 yrs) • Fewer chips + areal density source: Ed Grochowski, 1996, “IBM leadership in disk drive technology”; www.storage.ibm.com/storage/technolo/grochows/grocho01.htm,
Chips / 3.5 inch Disk: 1993 v. 1994 15 vs. 12 chips; 2 chips (head, misc) in 200x?
Latency = Queuing Time + Controller time + Seek Time + Rotation Time + Size / Bandwidth { per access + per byte State of the Art: Seagate Cheetah 18 • 6962 cylinders, 12 platters • 18.2 GB, 3.5 inch disk • 1MB track buffer(+ 4MB optional expansion) • 19 watts • 0.15 ms controller time • avg. seek = 6 ms (seek 1 track = 1 ms) • 1/2 rotation = 3 ms • 21 to 15 MB/s media (=> 16 to 11 MB/s) • deliver 75% (ECC, gaps...) • $1647 or 11MB/$ (9¢/MB) Track Sector Cylinder Track Buffer Arm Platter Head source: www.seagate.com; www.pricewatch.com; 5/21/98
C C C C Disk Limit: I/O Buses • Cannot use 100% of bus • Queuing Theory (< 70%) • Command overhead(Effective size = size x 1.2) • Multiple copies of data,SW layers Memory bus CPU • Bus rate vs. Disk rate • SCSI: Ultra2 (40 MHz), Wide (16 bit): 80 MByte/s • FC-AL: 1 Gbit/s = 125 MByte/s (single disk in 2002) Internal I/O bus Memory External I/O bus (PCI) (SCSI) (15 disks) Controllers
Disk Challenges / Innovations • Cost SCSI v. EIDE: • $275: IBM 4.3 GB, UltraWide SCSI (40MB/s) 16MB/$ • $176: IBM 4.3 GB, DMA/EIDE (17MB/s) 24MB/$ • Competition, interface cost, manufact. learning curve? • Rising Disk Intelligence • SCSI3, SSA, FC-AL, SMART • Moore’s Law for embedded processors, too source: www.research.digital.com/SRC/articles/199701/petal.html; www.pricewatch.com
Disk Limit • Continued advance in capacity (60%/yr) and bandwidth (40%/yr.) • Slow improvement in seek, rotation (8%/yr) • Time to read whole disk Year Sequentially Randomly 1990 4 minutes 6 hours 2000 12 minutes 1 week • Dynamically change data layout to reduce seek, rotation delay? Leverage space vs. spindles?
Disk Summary • Continued advance in capacity, cost/bit, BW; slow improvement in seek, rotation • External I/O bus bottleneck to transfer rate, cost?=> move to fast serial lines (FC-AL)? • What to do with increasing speed of embedded processor inside disk?
Network Description/Innovations • Shared Media vs. Switched: pairs communicate at same time • Aggregate BW in switched network is many times shared • point-to-point faster only single destination, simpler interface • Serial line: 1 – 5 Gbit/sec • Moore’s Law for switches, too • 1 chip: 32 x 32 switch, 1.5 Gbit/sec links, $39648 Gbit/sec aggregate bandwidth (AMCC S2025)
Network Performance Model Sender Overhead Sender Transmission time (size ÷ band- width) (processor busy) Receiver Overhead Time of Flight Receiver (processor busy) Transport Latency Total Latency Total Latency = per access + Size x per byte per access = Sender+ ReceiverOverhead+ Time of Flight (5 to 200 µsec+5 to 200 µsec+ 0.1 µsec) per byte + Size ÷ 100 MByte/s +
Network History/Limits • TCP/UDP/IP protocols for WAN/LAN in 1980s • Lightweight protocols for LAN in 1990s • Limit is standards and efficient SW protocols 10 Mbit Ethernet in 1978 (shared) 100 Mbit Ethernet in 1995 (shared, switched) 1000 Mbit Ethernet in 1998 (switched) • FDDI; ATM Forum for scalable LAN (still meeting) • Internal I/O bus limits delivered BW • 32-bit, 33 MHz PCI bus = 1 Gbit/sec • future: 64-bit, 66 MHz PCI bus = 4 Gbit/sec
Network Summary • Fast serial lines, switches offer high bandwidth, low latency over reasonable distances • Protocol software development and standards committee bandwidth limit innovation rate • Ethernet forever? • Internal I/O bus interface to network is bottleneck to delivered bandwidth, latency
Memory History/Trends/State of Art • DRAM: main memory of all computers • Commodity chip industry: no company >20% share • Packaged in SIMM or DIMM (e.g.,16 DRAMs/SIMM) • State of the Art: $152, 128 MB DIMM (16 64-Mbit DRAMs),10 ns x 64b (800MB/sec) • Capacity: 4X/3 yrs (60%/yr..) • Moore’s Law • MB/$: + 25%/yr. • Latency: – 7%/year, Bandwidth: + 20%/yr. (so far) source: www.pricewatch.com, 5/21/98
Memory Innovations/Limits • High Bandwidth Interfaces, Packages • RAMBUS DRAM: 800 – 1600 MByte/sec per chip • Latency limited by memory controller, bus, multiple chips, driving pins • More Application Bandwidth => More Cache misses= per access + block size x per byte Memory latency + Size / (DRAM BW x width) = 150 ns + 30 ns • Called Amdahl’s Law: Law of diminishing returns Proc Cache Bus D R A M D R A M D R A M D R A M
Memory Summary • DRAM rapid improvements in capacity, MB/$, bandwidth; slow improvement in latency • Processor-memory interface (cache+memory bus) is bottleneck to delivered bandwidth • Like network, memory “protocol” is major overhead
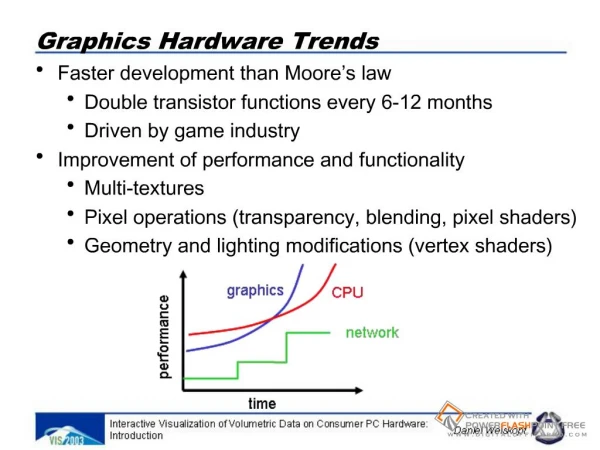
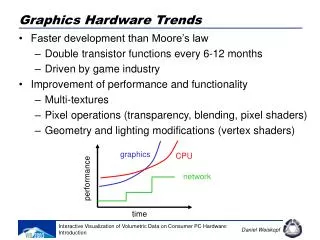
CPU time = Seconds = Instructions x Clocks x Seconds Program Program Instruction Clock Processor Trends/ History • Microprocessor: main CPU of “all” computers • < 1986, +35%/ yr. performance increase (2X/2.3yr) • >1987 (RISC), +60%/ yr. performance increase (2X/1.5yr) • Cost fixed at $500/chip, power whatever can cool • History of innovations to 2X / 1.5 yr (Works on TPC?) • Multilevel Caches (helps clocks / instruction) • Pipelining (helps seconds / clock, or clock rate) • Out-of-Order Execution (helps clocks / instruction) • Superscalar (helps clocks / instruction)
Pipelining is Natural! A B C D • Laundry Example • Ann, Brian, Cathy, Dave each have one load of clothes to wash, dry, fold, and put away • Washer takes 30 minutes • Dryer takes 30 minutes • “Folder” takes 30 minutes • “Stasher” takes 30 minutesto put clothes into drawers
Sequential Laundry 2 AM 12 6 PM 1 8 7 11 10 9 30 30 30 30 30 30 30 30 30 30 30 30 30 30 30 30 T a s k O r d e r Sequential laundry takes 8 hours for 4 loads Time A B C D
Pipelined Laundry: Start work ASAP 2 AM 12 6 PM 1 8 7 11 10 9 Time Pipelined laundry takes 3.5 hours for 4 loads! 30 30 30 30 30 30 30 T a s k O r d e r A B C D
30 30 30 30 30 30 30 bubble D Pipeline Hazard: Stall 2 AM 12 6 PM 1 8 7 11 10 9 Time A depends on D; stall since folder tied up T a s k O r d e r A B C E F
bubble Out-of-Order Laundry: Don’t Wait 2 AM 12 6 PM 1 8 7 11 10 9 Time A depends on D; rest continue; need more resources to allow out-of-order 30 30 30 30 30 30 30 T a s k O r d e r A B C D E F
30 30 30 30 30 (light clothing) A (dark clothing) B (very dirty clothing) C (light clothing) (dark clothing) (very dirty clothing) Superscalar Laundry: Parallel per stage 2 AM 12 6 PM 1 8 7 11 10 9 Time More resources, HW match mix of parallel tasks? T a s k O r d e r D E F
(light clothing) A D B C Superscalar Laundry: Mismatch Mix 2 AM 12 6 PM 1 8 7 11 10 9 Time Task mix underutilizes extra resources 30 30 30 30 30 30 30 T a s k O r d e r (light clothing) (dark clothing) (light clothing)
State of the Art: Alpha 21264 • 15M transistors • 2 64KB caches on chip; 16MB L2 cache off chip • Clock <1.7 nsec, or >600 MHz (Fastest Cray Supercomputer: T90 2.2 nsec) • 90 watts • Superscalar: fetch up to 6 instructions/clock cycle, retires up to 4 instruction/clock cycle • Execution out-of-order
µProc 60%/yr.. 1000 CPU “Moore’s Law” 100 Processor-Memory Performance Gap:(grows 50% / year) Performance 10 DRAM 7%/yr.. DRAM 1 1980 1981 1982 1983 1984 1985 1986 1987 1988 1989 1990 1991 1992 1993 1994 1995 1996 1997 1998 1999 2000 Processor Limit: DRAM Gap • Alpha 21264 full cache miss in instructions executed: 180 ns/1.7 ns =108 clks x 4 or 432 instructions • Caches in Pentium Pro: 64% area, 88% transistors
Processor Limits for TPC-C SPEC- Pentium Pro int95 TPC-C • Multilevel Caches: Miss rate 1MB L2 cache 0.5% 5% • Superscalar (2-3 instr. retired/clock): % clks 40% 10% • Out-of-Order Execution speedup 2.0X 1.4X • Clocks per Instruction 0.8 3.4 • % Peak performance 40% 10% source: Kim Keeton, Dave Patterson, Y. Q. He, R. C. Raphael, and Walter Baker. "Performance Characterization of a Quad Pentium Pro SMP Using OLTP Workloads," Proc. 25th Int'l. Symp. on Computer Architecture, June 1998. (www.cs.berkeley.edu/~kkeeton/Papers/papers.html ) Bhandarkar, D.; Ding, J. “Performance characterization of the Pentium Pro processor.” Proc. 3rd Int'l. Symp. on High-Performance Computer Architecture, Feb 1997. p. 288-97.
Processor Innovations/Limits • Low cost , low power embedded processors • Lots of competition, innovation • Integer perf. embedded proc. ~ 1/2 desktop processor • Strong ARM 110: 233 MHz, 268 MIPS, 0.36W typ., $49 • Very Long Instruction Word (Intel,HP IA-64/Merced) • multiple ops/ instruction, compiler controls parallelism • Consolidation of desktop industry? Innovation? x86 IA-64 SPARC Alpha PowerPC MIPS PA-RISC
Processor Summary • SPEC performance doubling / 18 months • Growing CPU-DRAM performance gap & tax • Running out of ideas, competition? Back to 2X / 2.3 yrs? • Processor tricks not as useful for transactions? • Clock rate increase compensated by CPI increase? • When > 100 MIPS on TPC-C? • Cost fixed at ~$500/chip, power whatever can cool • Embedded processors promising • 1/10 cost, 1/100 power, 1/2 integer performance?
Systems: History, Trends, Innovations • Cost/Performance leaders from PC industry • Transaction processing, file service based on Symmetric Multiprocessor (SMP)servers • 4 - 64 processors • Shared memory addressing • Decision support based on SMP and Cluster (Shared Nothing) • Clusters of low cost, small SMPs getting popular
State of the Art System: PC • $1140 OEM • 1 266 MHz Pentium II • 64 MB DRAM • 2 UltraDMA EIDE disks, 3.1 GB each • 100 Mbit Ethernet Interface • (PennySort winner) source: www.research.microsoft.com/research/barc/SortBenchmark/PennySort.ps
TPC-D,Oracle 8, 3/98 SMP 64 336 MHz CPUs, 64GB dram, 668 disks (5.5TB) Disks,shelf $2,128k Boards,encl. $1,187k CPUs $912k DRAM $768k Power $96k Cables,I/O $69k HW total $5,161k Proc Proc Proc Proc Proc Proc Proc Proc s s bridge bridge bus bridge bus bridge s c s i s c s i s c s i s c s i s c s i s c s i State of the Art SMP: Sun E10000 4 address buses data crossbar switch Xbar Xbar Mem Mem … 16 1 s c s i s c s i s c s i s c s i … … … … … … … … … 23 source: www.tpc.org 1
TPC-D, TD V2, 10/97 32 nodes x 4 200 MHz CPUs, 1 GB DRAM, 41 disks (128 cpus, 32 GB, 1312 disks, 5.4 TB) CPUs, DRAM, encl., boards, power $5,360k Disks+cntlr $2,164k Disk shelves $674k Cables $126k Console $16k HW total $8,340k Proc Proc Proc Proc Proc Proc Proc Proc Mem bridge bridge Mem Mem bus bridge bus bridge s c s i s c s i s c s i s c s i s c s i s c s i State of the art Cluster: NCR WorldMark BYNET switched network Bus Bus Mem pci pci … 32 1 … … … … … … … … … 64 1 source: www.tpc.org
State of the Art Cluster: Tandem/Compaq SMP • ServerNet switched network • Rack mounted equipment • SMP: 4-PPro, 3GB dram, 3 disks (6/rack) • 10 Disk shelves/rack@ 7 disks/shelf • Total: 6 SMPs (24 CPUs, 18 GB DRAM), 402 disks (2.7 TB) • TPC-C, Oracle 8, 4/98 • CPUs $191k • DRAM, $122k • Disks+cntlr $425k • Disk shelves $94k • Networking $76k • Racks $15k • HW total $926k
Berkeley Cluster: Zoom Project • 3 TB storage system • 370 8 GB disks, 20 200 MHz PPro PCs, 100Mbit Switched Ethernet • System cost small delta (~30%) over raw disk cost • Application: San Francisco Fine Arts Museum Server • 70,000 art images online • Zoom in 32X; try it yourself! • www.Thinker.org (statue)
User Decision Support Demand vs. Processor speed Database demand: 2X / 9-12 months Database-Proc. Performance Gap: “Greg’s Law” CPU speed 2X / 18 months “Moore’s Law”
Outline • Technology: Disk, Network, Memory, Processor, Systems • Description/Performance Models • History/State of the Art/ Trends • Limits/Innovations • Technology leading to a New Database Opportunity? • Common Themes across 5 Technologies • Hardware & Software Alternative to Today • Benchmarks
Review technology trends to help? • Desktop Processor: + SPEC performance – TPC-C performance, – CPU-Memory perf. gap • Embedded Processor: + Cost/Perf, + inside disk– controllers everywhere Disk Memory Network • Capacity ++ … • Bandwidth +++ • Latency –– – • Interface –––
Bus I/O I/O D R A M I/O I/O D R A M IRAM: “Intelligent RAM” C C Proc $ $ Microprocessor & DRAM on a single chip: • on-chip memory latency 5-10X, bandwidth 50-100X • serial I/O 5-10X v. buses • improve energy efficiency 2X-4X (no off-chip bus) • reduce number of controllers • smaller board area/volume L2$ C C Bus Bus C ... Proc D R A M Bus
Low cost, low power processor & memory included in disk at little extra cost (e.g., Seagate optional track buffer) Scaleable processing AND communication as increase disks cross bar cross bar cross bar IRAM IRAM IRAM IRAM IRAM IRAM IRAM IRAM “Intelligent Disk”(IDISK):Scalable Decision Support? … … … … … … … … …
IDISK Cluster • HW, assembly cost: ~$1.5 M • 8 disks, 8 CPUs, DRAM /shelf • 15 shelves /rack= 120 disks/rack • 1312 disks / 120 = 11 racks • Connect 4 disks / ring • 1312 / 4 = 328 1.5 Gbit links • 328 / 16 => 36 32x32 switch
Cluster IDISK Software Models 1) Shared Nothing Database: (e.g., IBM, Informix, NCR TeraData, Tandem) 2) Hybrid SMP Database: Front end running query optimizer, applets downloaded into IDISKs 3) Start with Personal Database code developed for portable PCs, PDAs (e.g., M/S Access, M/S SQLserver, Oracle Lite, Sybase SQL Anywhere) then augment withnew communication software
Back of the Envelope Benchmarks • All configurations have ~300 disks • Equivalent speeds for central and disk procs. • Benchmarks: Scan, Sort, Hash-Join
Scan 12.6X • Scan 6 billion 145 B rows • TPC-D lineitem table • Embarrassingly parallel task; limited by number processors • IDISK Speedup: • NCR: 2.4X • Compaq: 12.6X 2.4X
MinuteSort • External sorting: data starts and ends on disk • MinuteSort: how much can we sort in a minute? • Benchmark designed by Nyberg, et al., SIGMOD ‘94 • Current record: 8.4 GB on 95 UltraSPARC I’s w/ Myrinet [NOWSort:Arpaci-Dusseau97] • Sorting Review: • One-pass sort: data sorted = memory size • Two-pass sort: • Data sorted proportional to sq.rt. (memory size) • Disk I/O requirements: 2x that of one-pass sort
IDISK sorts 2.5X - 13X more than clusters IDISK sort limited by disk B/W Cluster sorts limited by network B/W MinuteSort
Hash-Join 5.9X • Hybrid hash join • R: 71k rows x 145 B • S: 200k rows x 165 B • TPC-D lineitem, part • Clusters benefit from one-pass algorithms • IDISK benefits from more processors, faster network • IDISK Speedups: • NCR: 1.2X • Compaq: 5.9X 1.2X
Other Uses for IDISK • Software RAID • Backup accelerator • High speed network connecting to tapes • Compression to reduce data sent, saved • Performance Monitor • Seek analysis, related accesses, hot data • Disk Data Movement accelerator • Optimize layout without using CPU, buses