Spatial Data Models and Structure
Spatial Data Models and Structure. Part 1: Basic Geographic Concepts. Real world -> Digital Environment GIS data represent a simplified view of physical phenomena These data contain: Locational Information Non-spatial attributes. Symbolization.

Spatial Data Models and Structure
E N D
Presentation Transcript
Part 1: Basic Geographic Concepts • Real world -> Digital Environment • GIS data represent a simplified view of physical phenomena • These data contain: • Locational Information • Non-spatial attributes
Symbolization • In a GIS, we represent real world phenomena in a digital format 1 0 0 1 0 0 1 1 1 1 1 0
Vocabulary • Real-World Entities or Phenomena • Data Objects • Cartographic Objects
Terminology • Entities or Phenomenon -- real world features to be represented in a database
Terminology • Data Objects -- digital representations of entities or phenomena Pasture House Road
Terminology • Cartographic Objects -- real-world entities as depicted on maps
Real World Data Objects • Attributes • Information about object (e.g., characteristics) • Location/Spatial information • Coordinates • May contain elevation information • Time • When collected/created • Why? Objects may have different attributes over time
Real World Cartographic Objects • Real world objects differ in: • Size • Shape • Color • Pattern • These differences affect how these objects are represented on maps • Where possible the cartographic objects (i.e., map symbols) can relate to the entities they are representing (e.g., water = blue)
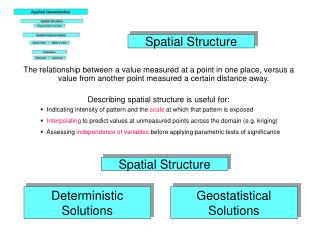
Topology • The spatial relationships between data objects
Conceptualizing Topology • Primary • Adjacency • Connectivity • Containment • Secondary • Direction • Proximity (distance)
Adjacency Springfield Shelbyville
Connectivity These roads are connected at the black points.
Containment Springfield Moe’s Kwik-E-Mart Nuclear Plant
Moe’s Kwik-E-Mart Nuclear Plant Direction Moe’s is Northeast of the Kwik-E-Mart The nuclear plant is Southeast of the Kwik-E-Mart
Proximity Homer lives near Ned Homer lives far from Grampa
Complex Case: Overlap Blue Lake Springfield
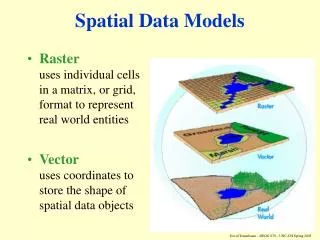
Part 2: GIS Data Models • Entities in the real world are represented as one of the following in a GIS: • Raster data • Pixels in an array • Vector data • Points • Lines • Areas (or polygons) Key concept!
Continuous & Discrete • “The continuous field view represents the real world as a finite number of variables, each one defined at every possible position. “ • “The discrete object view represents the geographic world as objects with well-defined boundaries in otherwise empty space. “
Continuous & Discrete • Some data types may be presented as either discrete or continuous • Example • Population at a point (discrete) • Population density surface for an area (continuous)
Continuous & Discrete • Continuous • Data values distributed across a surface w/out interruption • Key words: What varies and how smooth? • Examples: elevation, temperature • Discrete • with well-defined boundaries in otherwise empty space • Examples • Points: Town, power pole • Lines: Highway, stream • Areas: U.S. Counties, national parks
Continuous or Discrete? www.regional.org.au/au/asa/2003/i/6/walcott.htm
Continuous & Discrete • In computer databases • Raster data models represent continuous data • Vector data model are used for discrete objects
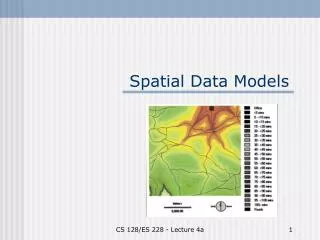
Cell (x,y) Cell value Cell size = resolution columns Raster Data Model The raster data model represents the Earth’s surface as a two-dimensional array of grid cells, with each cell having an associated value: rows
Raster data example Elevation data: each cell contains a number representing the elevation of that cell.
Vector Data Objects Geographic building blocks • Points • 0 dimensional • Lines • 1 dimensional • Polygons • 2 dimensional
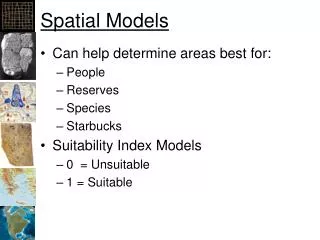
Spatial Objects • Data objects in the vector data model can be: • Apoint can represent: • Tree, airport, a city, street intersection, a movie theater, a benchmark • Aline is a data object, made up of a connected sequence of points. It can represent: • Roads, rivers, regional boundaries, fences, hedgerows, power lines • Apolygon is an enclosed area. Examples: • A census tract, Saunders building, boundary of Chapel Hill, a lake, a watershed, a city
Thought question: How are you going to represent the California OAK tree in digital format? A point? A polygon? Or a pixel? It will depend on: • Scale of observation • Purpose of your research • The type of data you have access to in the GIS
Thought questions: • When do you want to represent Chapel Hill as a polygon object instead of a point object? • When do you want to represent a river as a polygon instead of a line?
The vector data objects (x,y) (x,y) (x,y) (x,y) (x,y) (x,y) (x,y) • The vector data model represents geographic features similar to the way maps do • A point: recorded by a pair of (x,y) coordinates. • A line: recorded by joining more than one point, • A polygon: recorded by a joining multiple points that enclose an area (x,y) (x,y) (x,y) (x,y) point line polygon(area)
Vector Data Storage in Computers: Points Data Storage Points Point ID Coordinates +4 1 1, 1 2 4, 2 3 6, 2 4 2, 4 +2 +3 +1 0
(x3,y3) ② ① (x2,y2) (x1,y1) Line # Coordinates ① (x1, y1) (x2,y2) ② (x2,y2) (x3,y3) Vector Data Storage in Computers: Lines (Sometimes called arcs) Note: In GIS, this is considered a line (a connected set of individual lines).
(x4,y4) (x5,y5) (x1,y1) ② ① (x6,y6) (x3,y3) (x2,y2) Polygon # Coordinates ① (x1,y1) (x2,y2) (x3,y3) (x4,y4) ② (x3,y3) (x4,y4) (x5,y5) (x6,y6) Vector Data Storage in Computers: Polygons
The Arc-Node Data Structure Benefit: The arc-node structure allows efficient data storage for vector data How does it work? It stores data so that nodes construct arcs, and arcs construct polygons Nodes define the two endpoints of an arc. They may or may not connect two or more arcs. An arc is the line segment between two nodes. The points between two nodes defining the shape of an arc are called vertices. Nodes and vertices are represented as x, y coordinates.
Arc # Start Node Vertices End Node • 2 1,6 5 • 2 3,4 5 • 2 5 Polygon arc list A ①, ③ B②, ③ The Arc-Node Data Structure 2 Arc: ①, ②, ③ Nodes: 2, 5 Vertices: 1, 6 for arc ① 3, 4 for arc ② 3 1 ③ B ② A ① 4 5 6 • Points • 1 x1,y1 • 2 x2,y2 • 3 x3,y3 • x4,y4 • 5 x5,y5 • 6 x6,y6
Arc-Node Data Structure:enables topology definition Topology defines spatial relationships. The arc-node data structure supports three major topological concepts: Connectivity: Arcs connect to each other at nodes Area definition: Arcs that connect to surround an area define a polygon Contiguity: Arcs have direction and left and right sides
Topology: Connectivity Connected arcs are determined by searching through the list for common node numbers. Arc-node list 10 11 12 ① ② • Arc From-Node To-Node • 10 11 • 11 12 • 11 13 • 13 15 • 13 14 ③ ⑤ 13 14 ④ 15 Because of the common node 11, arcs 1, 2, and 3 all intersect. The computer can determine that it is possible to travel along arc 1 and turn onto arc 3. But it is not possible to turn directly from arc 1 to arc 5.
Topology: Area Definition Polygon-Arc Topology 1 8 Polygon Arc List B 1,5,8,4 C 2,6,9,5 D 6,3,4,7 E 9,7,8 B 5 C 4 2 E 9 D 6 7 3 Polygons are simply the list of arcs defining its boundary, arc coordinates are stored only once, therefore, reducing the amount of data and ensuring that the boundaries of adjacent polygons don’t overlap
Topology: Contiguity Two geographic features which share a boundary are called adjacent. Contiguity is the topological concept which allows the vector data model to determine adjacency. An Arc left From-Node To-Node right Direction 1 8 • Arc Left Right • Polygon Polygon • C B • E C • ? ? • 1 ? ? B 5 C 4 2 E 9 D 6 7 3