Download
1 / 64
640 likes | 1.03k Vues
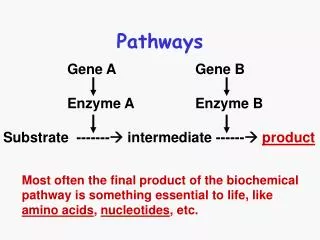
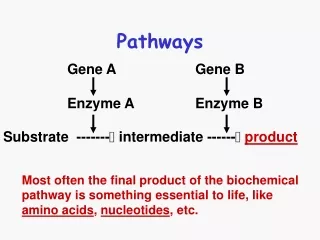
HOUSTON Pathways Project & Developmental Education Initiatives Dr. Juan Carlos Reina Director Academic Resource Development, HCC Dr. Catherine O’Brien Dean of Teaching and Learning, SJCCD. Houston Pathways. Funded by the Houston Endowment Partnering Institutions:

E N D
HOUSTON Pathways Project& Developmental Education InitiativesDr. Juan Carlos ReinaDirector Academic Resource Development, HCCDr. Catherine O’BrienDean of Teaching and Learning, SJCCD
Houston Pathways • Funded by the Houston Endowment • Partnering Institutions: • Houston Community College (HCC, fiscal agent) • San Jacinto Community College (SJCD) • Grossmont-Cuyamaca CCD ( through the California-Partnership for Achieving Student Success, Cal-Pass) • The Texas Higher Education Coordinating Board (THECB)
Pathway Project Overview • Partners (secondary and post-secondary) from all levels of education agree to share student level data: Pipelines: • Houston Community College • Houston Independent School District • Spring Branch Independent School District • University of Houston Central • University of Houston –Downtown • San Jacinto Community College • Deer Park Independent School District • Galena Park Independent School District • Pasadena Independent School District • University of Houston-Clear Lake
Partners assign faculty members from all levels to meet on a monthly basis. The data is then used to generate reports for faculty teams. The faculty teams use the data to fuel interventions designed to increase student success. HOUSTON PATHWAYS
Data Collected • Enrollment • Course (grades included) • Graduation Data • Reporting Manuals http://www.txhighereddata.org/ReportingManuals.cfm
Faculty Team Reports • The first faculty team reports were designed to match CAL-PASS reports. • CAL-PASS’s reporting methods are “time tested”. • The reports are basically a simple student-course to student-course match.
Faculty Team Reports- Alignment Reports • Alignment reports are designed to illustrate possible gaps in secondary/ post-secondary alignment.
Faculty Team Reports- Alignment Reports (Cont.) College Calculus College Pre-Calculus H.S. Pre-Calculus Below College Pre-Calculus
Faculty Team Reports • Cohort Studies • Predictive modeling • Special Topic Reports • Study Skills • Dual Credit • Developmental Education • Outcome reports • Survey results
Faculty Team Reports • Giving faculty teams reports at the ISD level is important to the Pathways process. • Understanding how different student populations affect alignment • Understanding how successful ISD projects are effecting current alignment • Pathways project does not compare ISD’s. • It only evaluates Pathways’ interventions.
Faculty Teams • Faculty Teams are focused around local need for vertical alignment . • Houston Faculty Teams • Mathematics • English • U.S. History (Social Sciences) • Biology (Sciences)
Faculty Teams • Faculty teams are supported by a regional coordinator, the THECB, and Cal-PASS. • Faculty teams meet once a month. • Initially, faculty teams meetings center around team organization and faculty reports. • Then, faculty teams are charged with development of interventions for all education levels to better align secondary and post-secondary.
First College Math Course at a 2-year institution for Students who passed Algebra 2 in High School 88.3% Start in D.E.
First College Math Course at a 2-year institution for Students who earned an “A” in Algebra 2 73.5% Start in D.E.
First College Math Course at a 2-year institution for Students who earned a “B” in Algebra 2 84.7 % Start in D.E.
First College Math Course at a 2-year institution for Students who earned a “C” in Algebra 2 91.8 % Start in D.E.
First College Math Course at a 2-year institution for Students who took Algebra 2 in High School by Course Grade
Overall Success Rates in First College Math Course at a 2-year institution for Students who took Algebra 2 in High School by Course Grade
First College Math Course at a 4-year institution for Students who passed Algebra 2 in High School 59.2% Start in D.E.
First College Math Course at a 4-year institution for Students who earned an “A” in Algebra 2 44.9% Start in D.E.
First College Math Course at a 4-year institution for Students who earned a “B” in Algebra 2 54.1% Start in D.E.
First College Math Course at a 4-year institution for Students who earned a “C” in Algebra 2 67.0% Start in D.E.
First College Math Course at a 4-year institution for Students who took Algebra 2 in High School by Course Grade
Overall Success Rates in First College Math Course at a 4-year institution for Students who took Algebra 2 in High School by Course Grade
Contacts • Juan Carlos Reina, Ph.D. • Director Academic Resource Development • 3100 Main Street, Suite 12E 19, MC 1763 • Houston, Texas, 77002 • 713 718 5225 juan.reina@hccs.edu • Dr. Catherine O’Brien • Dean Teaching and Learning • 4624 Fairmont Parkway, Suite 101 • Pasadena, TX 77504-3398 • 281 998 6318 catherine.obrien@sjcd.edu
Houston Community College Initiatives Developmental Education Initiative (DEI)Gates Grant
Background: Achieving the Dream (2003 – 2008) 1. Freshman Success Courses: a. GUST 1270: College and Career Exploration b. ENGR 1201: Introduction to Engineering c. HPRS 1201: Introduction to the Health Professions d. EDUC 1200: Careers in Education
ATD Strategies • Learning Communities: co-enrollment of students in two or more courses • Bridge Courses or Experiences: a. Survival Camp for LVN students b. Summer Bridge Progs – SE and SW c. Developmental Math bridge courses
Gates DEI Grant(2009-2012) 1. Improved Coordination of Developmental Education a. Fall 2009 – testing of ALL new students b. Pre-requisite skills for all courses c. Continuous remediation – reading, math, writing d. CTLE courses for ATD strategies
Gates DEI Strategies 2. Developmental Math Initiative a. SLO for all MATH courses and alignment with HS courses b. Creation of bridge courses (0106, 0108, 0112) and appropriate cut scores c. Use of Learning Communities d. Addition of Lab Hours and use of Supplemental Instruction e. Creation of Master Courses and OER
Gates DEI Strategies 3. Freshman Success Courses for all HCC students a. CTE to develop cluster-specific LEAD 1200 courses b. Foundations of Excellence program: (1) Philosophy and organization (2) Learning and assessment (3) Student Services
Gates DEI Strategies 3. Freshman Success Courses (cont). c. HCC-NW “super” Learning Community d. Instructional Design Coordinators – technology components to support FSC and LC – e.g., Facebook, Twitter, etc. e. Master Courses, accelerated course formats, hybrid courses
Grant Management Team • Grant Director: Maria Straus • Policy Coordination: Charles Cook • Course entry/exit requirements: Mark Tengler and Larry Markey • Course Alignment: Juan Carlos Reina • Student Feedback: Cheryl Sterling • Master Courses: Steve Levey • Faculty Development: David Diehl
Grant Management Team Math Initiatives: Juan Carlos Reina and Math Dis/Dept Chairs: MATH 0306: Tim Sever MATH 0308: Emmanuel Usen MATH 0312: Bill Echols, Ernest Lowery MATH 0314: Mahmoud Shagroni Math Professional Dev: Michael Bohn
Grant Management Team FSC Leader: Betty Fortune LC Leader: Chyrell Botts FOE Leader: Rey Garay CTE Leader: Charles Hebert IDC Leader: Doug Rowlett Assessment: Martha Oburn Semester reports to Chancellor’s Strategic Team and all Deans’ Councils
Math Cohort Study- Methods • Using 5 of the school district’s, we tracked a the 2005-2006 graduation cohort back 4 years in High School and forward 2 years in Higher Education. • Only students who could be found for 4 years in H.S. were included.
Participants • A total of 9918 students in the FY2006 H.S Graduation cohort. • 409(4%) students were non- trackable. • Latinos were disproportionally more likely to be removed ( χ2 (4)=114.6, p<.0001). • The economically disadvantaged were disproportionally more likely to be removed ( χ2 (1)=114.7, p<.0001). • Then, 1200 (12.6%) students removed for not having 4 years of H.S. in the database. • Latinos and African-Americans were disproportionally more likely to be in this group (χ2(4)=118.6, p<.0001).
Participants • The total sample was 8,309 students • 50.7% were female. • 63.1% were Hispanic, 27.5% white, 7.4% black, 1.9% Asian, and 0.1% Native American • 50.5% were economically disadvantaged. • 72.8% received a recommended H.S. Diploma, 11.1% minimum, 7.9% IEP, and only 8.2% distinguished
TAKS TEST • Analysis -Linear Regression • N=7,254 • Outcome Variable: • Exit Level Math TAKS Test • Predictor Variables : • Course Taking behavior (9 was the reference group) • Gender (female was the reference group) • Economically Disadvantaged ( not disadvantaged was the reference group) • The overall model was significant, ( F (10,6682)=560.97, p<.0001). • Approximately, 45.6% variance in the TAKS Math was explained by the predictor variables.
TAKS Test • Students who take Course Patterns ending in Pre- Calculus or Calculus perform better on the TAKS than students with ending in Algebra 2 even after the effects of SES and gender are removed.