WRITING
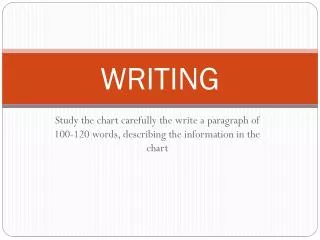
WRITING. Study the chart carefully the write a paragraph of 100-120 words, describing the information in the chart. Northern America 6%. Latin America 8 %. South Asia 32 %. Africa 11%. Europe 15 %. East Asia 26 %. Useful language. i t can be seen that d istributed unevenly

WRITING
E N D
Presentation Transcript
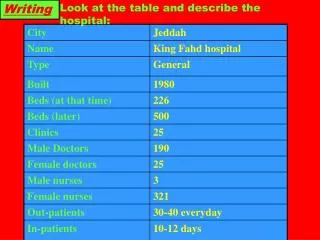
WRITING Study the chart carefully the write a paragraph of 100-120 words, describing the information in the chart
Northern America 6% Latin America 8% South Asia 32 % Africa 11% Europe 15 % East Asia 26 %
Useful language • it can be seen that • distributed unevenly • account for........per cent • more than double the population of • half as much as / nearly half of • rank first / last You may begin with: The chart shows the distribution of world population by region....
The chart shows the distribution of world population by region. As seen from the chart, the world population is distributed unevenly. South Asia has the largest population with 32 % while the Oceania is the least populated with only 2%. A bit higher than that of the Oceania are the rates of Latin America and Northern America with 8% for the former and 6% for the latter (with 8% and 6% respectively). Europe accounts for 15% of the world population and Africa is a bit lower with only 11%. To sum up, more people are found in Asia than in other parts of the world.
Further practice: Fill in the blank with a suitable word or phrases from the list below
more than double ranks firstdistributed unevenly accounts forpopulated rate • The chart shows the distribution of Vietnam population by region. It can be seen that, Vietnam population is________________. Central Highlands is the least________________ with only 5%. North Central Coast is higher than the Central Highlands with the _________________of 13%. Middle Lands of Northern is________________ population of the South Central Coast. The Red River Delta________________19% of Vietnam population and Southeast is a bit lower with only 16%. The Mekong Delta has the largest population with 20% and ________________in all regions in Vietnam. distributed unevenly populated rate more than double accounts for ranks first
Introduction: should describe what the chart is about, its dates and location. Body:should describe the most important trend while all information is summarized to avoid unnecessary details. Notice how many features diagram has. Conclusion:should sum up all trends shown on the figures and compare them if possible. The chart shows the distribution of Vietnam population by region. It can be seen that, Vietnam population is distributed unevenly. Central Highlands is the least populated with only 5%. North Central Coast is higher than the Central Highlands with the rate of 13%. Middle Lands of Northern is more than double population of the South Central Coast. The Red River Delta accounts for 19% of Vietnam population and Southeast is a bit lower with only 16%. The Mekong Delta has the largest population with 20% and ranks first in all regions in Vietnam. To sum up, more people are found in The Mekong Delta than in other parts of Vietnam.