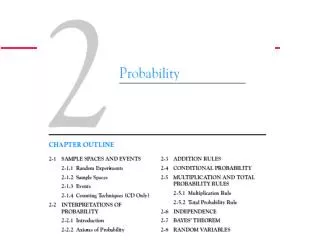
2-1 Sample Spaces and Events
780 likes | 1.38k Vues
2-1 Sample Spaces and Events. Conducting an experiment, in day-to-day repetitions of the measurement the results can differ slightly because of small variations in variables that are not controlled in our experiment. Consequently, this experiment is said to have a random component.

2-1 Sample Spaces and Events
E N D
Presentation Transcript
2-1 Sample Spaces and Events • Conducting an experiment, in day-to-day repetitions of the measurement the results can differ slightly because of small variations in variables that are not controlled in our experiment. • Consequently, this experiment is said to have a random component. • In some cases, the random variations, are small enough, relative to our experimental goals, that they can be ignored. • However, no matter how carefully our experiment is designed and conducted, the variation is almost always present, and its magnitude can be large enough that the important conclusions from our experiment are not obvious.
2-1 Sample Spaces and Events • Our goal is to understand, quantify, and model the type of variations that we often encounter. • When we incorporate the variation into our thinking and analyses, we can make informed judgments from our results that are not invalidated by the variation. • Models and analyses that include variation are not different from models used in other areas of engineering and science. Figure 2-1 displays the important components. • A mathematical model (or abstraction) of the physical system is developed. • It need not be a perfect abstraction. For example, Newton’s laws are not perfect descriptions of our physical universe.
2-1 Sample Spaces and Events • Still, they are useful models that can be studied and analyzed to approximately quantify the performance of a wide range of engineered products.
2-1 Sample Spaces and Events 2-1.1 Random Experiments Figure 2-1Continuous iteration between model and physical system.
2-1 Sample Spaces and Events 2-1.1 Random Experiments Figure 2-2Noise variables affect the transformation of inputs to outputs.
2-1 Sample Spaces and Events • Figure 2-2 graphically displays a model that incorporates uncontrollable inputs (noise) that combine with the controllable inputs to produce the output of our system.
2-1 Sample Spaces and Events 2-1.1 Random Experiments Definition
2-1 Sample Spaces and Events 2-1.1 Random Experiments Figure 2-3A closer examination of the system identifies deviations from the model.
2-1 Sample Spaces and Events • For the example of measuring current in a copper wire, our model for the system might simply be Ohm’s law. • Because of uncontrollable inputs, variations in measurements of current are expected. • Ohm’s law might be a suitable approximation. • However, if the variations are large relative to the intended use of the device under study, we might need to extend our model to include the variation.
2-1 Sample Spaces and Events 2-1.1 Random Experiments Figure 2-4Variation causes disruptions in the system.
2-1 Sample Spaces and Events • To model and analyze a random experiment, we must understand the set of possible outcomes from the experiment.
2-1 Sample Spaces and Events 2-1.2 Sample Spaces Definition
2-1 Sample Spaces and Events 2-1.2 Sample Spaces Example 2-1
2-1 Sample Spaces and Events Example 2-1 (continued)
2-1 Sample Spaces and Events Definition • A sample space is discrete if it consists of a finite or countable infinite set of outcomes. • A sample space is continuous if it contains an interval (either finite or infinite) of real numbers.
2-1 Sample Spaces and Events Example 2-2
2-1 Sample Spaces and Events Example 2-2 (continued)
2-1 Sample Spaces and Events Tree Diagrams • Sample spaces can also be described graphically withtree diagrams. • When a sample space can be constructed in several steps or stages, we can represent each of the n1 ways of completing the first step as a branch of a tree. • Each of the ways of completing the second step can be represented as n2 branches starting from the ends of the original branches, and so forth.
2-1 Sample Spaces and Events Example 2-3
2-1 Sample Spaces and Events Figure 2-5Tree diagram for three messages.
2-1 Sample Spaces and Events 2-1.3 Events Definition
2-1 Sample Spaces and Events 2-1.3 Events Basic Set Operations
2-1 Sample Spaces and Events 2-1.3 Events Example 2-6
2-1 Sample Spaces and Events Venn Diagrams
2-1 Sample Spaces and Events Definition
2-2 Interpretations of Probability • In this chapter, we introduce probability for discrete sample spaces—those with only a finite (or countably infinite) set of outcomes. • Probability is used to quantify the likelihood, or chance, that an outcome of a random experiment will occur. • The likelihood of an outcome is quantified by assigning a number from the interval [0, 1] to the outcome (or a percentage from 0 to 100%). • Higher numbers indicate that the outcome is more likely than lower numbers. A 0 indicates an outcome will not occur. A probability of 1 indicates an outcome will occur with certainty.
2-2 Interpretations of Probability • Another interpretation of probability is based on the conceptual model of repeated replications of the random experiment. • The probability of an outcome is interpreted as the limiting value of the proportion of times the outcome occurs in n repetitions of the random experiment as n increases beyond all bounds. • A relative frequency interpretation of probability.
2-2 Interpretations of Probability 2-2.1 Introduction Probability • Used to quantify likelihood or chance • Used to represent risk or uncertainty in engineering applications • Can be interpreted as our degree of belief or relative frequency
2-2 Interpretations of Probability 2-2.1 Introduction Figure 2-9Relative frequency of corrupted pulses sent over a communications channel.
2-2 Interpretations of Probability Equally Likely Outcomes
2-2 Interpretations of Probability Example 2-9
2-2 Interpretations of Probability Figure 2-10Probability of the event E is the sum of the probabilities of the outcomes in E
2-2 Interpretations of Probability Definition
2-2 Interpretations of Probability Example 2-10
2-2 Interpretations of Probability 2-2.2 Axioms of Probability
2-3 Addition Rules Addition Rule
2-3 Addition Rules Mutually Exclusive Events
2-3 Addition Rules Three or More Events
2-3 Addition Rules Figure 2-11Venn diagram of four mutually exclusive events
2-3 Addition Rules Example 2-15
2-4 Conditional Probability • To introduce conditional probability, consider an example involving manufactured parts. • Let D denote the event that a part is defective and let F denote the event that a part has a surface flaw. • Then, we denote the probability of D given, or assuming, that a part has a surface flaw as P(D|F). This notation is read as the conditional probability of D given F, and it is interpreted as the probability that a part is defective, given that the part has a surface flaw.
2-4 Conditional Probability Figure 2-12Conditional probabilities for parts with surface flaws
2-4 Conditional Probability • EXAMPLE 2-16 • Table 2-3 provides an example of 400 parts classified by surface flaws and as (functionally) defective. For this table the conditional probabilities match those discussed previously in this section. For example, of the parts with surface flaws (40 parts) the number defective is 10. Therefore, • P(D | F) =18/360 =0.05 • and of the parts without surface flaws (360 parts) the number defective is 18. Therefore, • P(D |F) =10/40 =0.25 • In Example 2-16 conditional probabilities were calculated directly. These probabilities can also be determined from the formal definition of conditional probability.
2-4 Conditional Probability Definition
2-4 Conditional Probability Therefore, P(B | A) can be interpreted as the relative frequency of event B among the trials that produce an outcome in event A.
2-5 Multiplication and Total Probability Rules The definition of conditional probability in Equation 2-5 can be rewritten to provide a general expression for the probability of the intersection of two events. This formula is referred to as a multiplication rule for probabilities.
2-5 Multiplication and Total Probability Rules 2-5.1 Multiplication Rule