Cylinder Liner Boring Process Improvement Case Study
Cylinder Liner Boring Process Improvement Case Study. Presented by Dr. Joan Burtner Certified Quality Engineer Associate Professor of Industrial Engineering and Industrial Management. Background. Company is a supplier to an engine manufacturer

Cylinder Liner Boring Process Improvement Case Study
E N D
Presentation Transcript
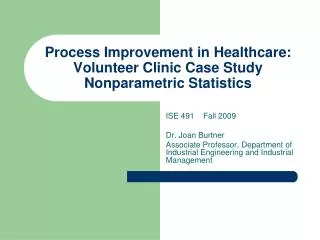
Cylinder Liner Boring Process Improvement Case Study Presented by Dr. Joan Burtner Certified Quality Engineer Associate Professor of Industrial Engineering and Industrial Management
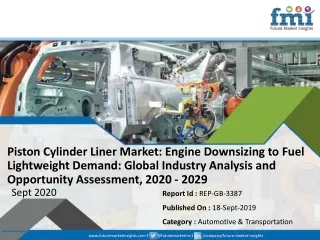
Background • Company is a supplier to an engine manufacturer • Company’s main product is a cast iron cylinder liner • Customer has notified supplier that it will issue more stringent specifications Presenter: Dr. Joan Burtner, Associate Professor of Industrial Engineering
Process Description – Flow Chart Presenter: Dr. Joan Burtner, Associate Professor of Industrial Engineering
Problem Definition - Defects • Application of new specifications to historical manufacturing data to predict potential defects Presenter: Dr. Joan Burtner, Associate Professor of Industrial Engineering
Problem Analysis – Potential Root Causes Presenter: Dr. Joan Burtner, Associate Professor of Industrial Engineering
Process Data – Initial Control Charts R Chart indicates that the process is out of control Presenter: Dr. Joan Burtner, Associate Professor of Industrial Engineering
Process Improvement – First Stage • Investigation showed that a substitute operator was working when samples 6, 16, and 36 were taken • Interviews with line supervisors and regular operators uncovered the fact that the substitute operator had not been trained on the cylinder boring machine • Corrective action: Provide training on proper machine operation Presenter: Dr. Joan Burtner, Associate Professor of Industrial Engineering
Process Improvement - Results • R chart indicates that the variability in the process is now in good statistical control • Xbar chart indicates presence of special causes Presenter: Dr. Joan Burtner, Associate Professor of Industrial Engineering
Process Improvement – Second Stage • Process Improvement Team (PIT) reviewed the cause-and-effect diagram and decided to investigate machine warm-up • Interpretation: Mean diameter decreases for first 90 minutes after start-up Presenter: Dr. Joan Burtner, Associate Professor of Industrial Engineering
Process Improvement – Additional Results • Process Improvement Team (PIT) brainstormed options • Change operating parameters during warm-up • Have machine go through accelerated warm-up while not producing any parts • Leave the machine on over the lunch hour and start operation after lunch • Team chose option 3 Presenter: Dr. Joan Burtner, Associate Professor of Industrial Engineering
Case StudyResolution • Both R and Xbar charts indicate process is now in control • Mean Range • 7.60 at beginning of case study • 6.60 at end of case study • Mean Process Mean changed from 200.250 to 200.005 Presenter: Dr. Joan Burtner, Associate Professor of Industrial Engineering
Acknowledgments/Further Reading • Case study (including figures) adapted from Chapter 6 of DeVor, R.E., Chang, T., and Sutherland, J.W. (2007). Statistical Quality Design and Control: Contemporary Concepts and Methods (2nd ed.). Upper Saddle River, NJ: Pearson Prentice Hall. • For additional information on problem-solving tools -- Westcott, R.T., Ed. (2006). Certified Manager of Quality/Organizational Excellence Handbook (3rd ed.). Milwaukee: ASQ Quality Press. Presenter: Dr. Joan Burtner, Associate Professor of Industrial Engineering
Contact Information • Email: Burtner_J@Mercer.edu • US Mail: Mercer University School of Engineering 1400 Coleman Avenue Macon, GA • Phone: (478) 301- 4127 Presenter: Dr. Joan Burtner, Associate Professor of Industrial Engineering