PS wirescanner calibration
PS wirescanner calibration. Student Meeting 10/03/2014. Carolina Bianchini BE-BI-BL. Outline. Wirescanner calibration. Calibration analysis . Calibration analysis...new method. Conclusions. Wirescanner calibration.


PS wirescanner calibration
E N D
Presentation Transcript
PS wirescanner calibration Student Meeting 10/03/2014 Carolina Bianchini BE-BI-BL
Outline Wirescanner calibration Calibration analysis Calibration analysis...new method Conclusions
Wirescanner calibration Wire Scanners are devices used for beam-profile measurement in the LHC and its injectors.
Wirescanner calibration PS Wirescanner Wire Scanners calibration is needed to correlate the potentiometer values with the projected position of the beam.
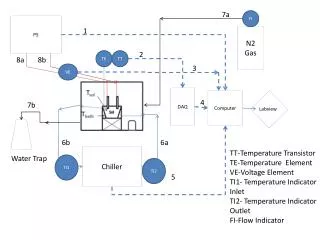
Wirescanner calibration PS Wirescanner calibration bench Wirescanner Splitter Laser Combiner Photodiode
Wirescanner calibration PS Wirescanner calibration procedure We move the system along the vertical axis with fix step and we record, at each position, the profile of the laser-beam. We repeat these measurement at two different speed: 10m/s and 15m/s. Photodiode signal Bits (angular position)
Wirescanner calibration PS Wirescanner calibration procedure At each position, we have to find the center of the two peak (in potentiometer bit). Photodiode signal Bits (angular position) 2.
Wirescanner calibration PS Wirescanner calibration procedure For each scanned position we plot the potentiometer center of the laser beams as function of the position. We fitted it with a polynomial curve. 3.
Wirescanner calibration PS Wirescanner calibration procedure The best polynomial curve order is chosen minimizing the average difference between the fit and the real values and looking for the best average of the peaks distance. 4. We generate a table to correlate the motor angular position (in bit) vs the projected position (in mm).
Calibration analysis • Actually the calibration data analysis is performed using a Java application written by BE/BI/SW. • The calibration data analysis is carried out in 3 steps: • Identification of the signals obtained during the measurements; • Identification of the two laser peaks. The first peak is the absolute minimum value of the signal registered by the photodiode. The second peak is found as the second minimum value in the region lowered by at least 40% of the previous peak value. - Generation of the tables.
Calibration analysis The method developed by Emiliano follows these steps: • Laser signal is cut with fix threshold (|Max-Min|*40%). • Average values in the first and in the second couple of points where the threshold is equal to the signal are calculated (P1 and P2). • Plot the average between P1 and P2 vs the projected position. • Fit the previous curve with polynomial function. • Generate calibration table.
Calibration analysis...new method My expected work as technical student is to develop a program with new mathematical routines and fit functions which will standardize calibrations quality assurance. During my first 3 months I have developed an alternative method in MATLAB to better perform the calibration data fit. I follow these logical steps: • I load data file to MatLab; • I take the signal and I divide into IN and OUT profile;
Calibration analysis...new method • I apply a threshold in order to clean the signal by the noise and I smooth the signal;
Calibration analysis...new method • I find 4 points where the signal is equal to the threshold (A, B, C, D). A B C D
Calibration analysis...new method • I divide the signal into 2 different regions, A-B and C-D. • In each region I apply another smooth (lower order) and I use a Gaussian fit to calculate the center of the peak. I obtain 2 values, peak1 and peak2.
Calibration analysis...new method • I calculate the average peak1, peak2 and I plot it vs position (in mm).
Calibration analysis...new method • I fit this curve with different polynomial order function and I choose the best polynomial result to generate the calibrationtable.
Calibration analysis...new method Average absolute error 107µm 15m/s IN Average absolute error 75µm Position difference (mm) Bits (angular position) Average absolute error 71µm improvement
Conclusions • New routines seems to improve PS & PSB calibration reliability. • First attempt done in MatLab showed good results, taking into account the electronic noise in the potentiometer reading. • Different filters are still under studying. • Once the procedure will be tested on all the PS & PSB calibrations, a final software will be developed in Python.
Thanks to... Emiliano 21