Download
1 / 91
940 likes | 1.31k Vues
Darren Gitelman, MD Northwestern University d-gitelman@northwestern.edu. PsychophysiologicAl Interactions. Systems analysis in functional neuroimaging. Functional specialisation Analyses of regionally specific effects Which regions are specialized for a particular task?)

E N D
Darren Gitelman, MD Northwestern University d-gitelman@northwestern.edu PsychophysiologicAl Interactions
Systems analysis in functional neuroimaging • Functional specialisation • Analyses of regionally specific effects • Which regions are specialized for a particular task?) • Univariate analysis • Functional integration • Analyses of inter-regional effects • What are the interactions between the elements of a neuronal system? • Univariate & Multivariate analysis Functional connectivity Effective connectivity Standard SPM K. Stephan, FIL
Systems analysis in functional neuroimaging Functional integration • Functional connectivity • Temporal correlations between spatially remote areas • MODEL-FREE • Exploratory • Data Driven • No Causation • Whole brain connectivity • Effective connectivity • The influence that one neuronal system exerts over another • MODEL-DEPENDENT • Confirmatory • Hypothesis driven • Causal (based on a model) • Reduced set of regions K. Stephan, FIL; S. Whitfield-Gabrieli
Factorial Design Task factor main effect of task Task B Task A TA/S1 TB/S1 main effect of stim. type Stim 1 Stimulus factor interaction TA/S2 TB/S2 Stim 2 Confounds + error Task Stimulus Confounds Interaction
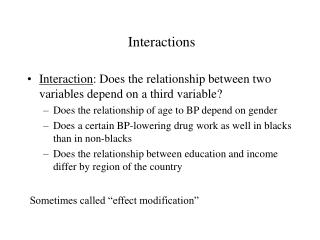
Interaction No Interaction B No Main Effect No main effect No interaction A significant interaction A Factor A is significant Factor B is significant Main Effect Significant main effects and interaction Factors A & B Are significant
Psychological interaction • Change in regression slope due to the differential response to one experimental condition under the influence of different experimental contexts.
Psychological interactions: Attention factor Task: Letters and tones presented concurrently. Tones presented at different rates. Subjects respond to either a target letter or a target tone. (PET scan). Letters Tones T/S1 L/S1 Stim 1 Stimulus factor T/S2 L/S2 Stim 2 Presentation rates Interaction Attentional condition T/S3 L/S3 Stim3 Is there a differential sensitivity to the presentation rate of tones when paying attention to tones vs. paying attention to letters? Frith & Friston, Neuroimage, 1997; Friston, Neuroimage, 1997
Main effect of tone presentation rate Activity in auditory cortex varies by presentation rate regardless of whether subjects paid attention to tones or letters. Frith & Friston, Neuroimage, 1997
Interaction between attention and presentation rate. Activity in the right thalamus is influenced by presentation rate of tones when subjects attended to tones vs. attending to letters. Frith & Friston, Neuroimage, 1997
Physiophysiological interaction • Change in regression slope due to the differential response of the signal (neural activity) from one region due to the signal from another (region).
Attention to visual motion Key M = Dummy scans (discarded) F = Fixation (central dot) A = Attention: radially moving dots. Subjects told to detect changes in speed of dots (no changes actually occurred during scanning). N = No attention: radially moving dots viewed passively. S = Stationary: 250 stationary dots Buchel et al, Cereb Cortex, 1997
Attention to motion: design Task factor No attention Attention TA/S1 TN/S1 main effect of task Stim 1 Stimulus factor main effect of stim. type TA/S2 TN/S2 Stim 2 interaction Activity in Region 1 Activity in Region 2
Physiophysiological interaction main effect of region 1 main effect of region 2 interaction
Physiophysiological interactions Task: Subjects asked to detect speed changes in radially moving dots (fMRI). Physiological activity in PP Interaction Physiological activity in V1 Does activity in posterior parietal (PP) cortex modulate the response to V1 activity (or is there a contribution from PP that depends on V1 activity?) Friston et al, Neuroimage, 1997
Interaction effect in V5 Physiophysiological Interaction Z=5.77 P < 0.001 • modulation of the V1 V5 contribution by PP? • modulation of the PP V5 contribution by V1? Friston et al, Neuroimage, 1997
Psychophysiological interactions Task factor No attention Attention main effect of task TA/S1 TN/S1 Stim 1 main effect of stim. type Stimulus factor TA/S2 TN/S2 Stim 2 interaction
Psychophysiological interactions • Change in regression slope due to the differential response of the signal from one region under the influence of different experimental contexts. • Bilinear model of how the psychological contextchanges the influence of one area on another. main effect of task main effect of V1 interaction Friston et al. NeuroImage, 1997
Psychophysiological interactions: Task: Subjects asked to detect speed changes in radially moving dots (fMRI). Physiological activity Interaction Psychological Parameter Does the task (attention) modulate the response, to V1 activity, or does activity in V1 influence the response to attention? [Inference on task and regional effects] Friston et al, Neuroimage, 1997
Psychophysiologic interaction • Two possible interpretations • Modulation of the contribution of V1 to V5 by attention (context specific) • Modulation of attention specific responses in V5 by V1 inputs (stimulus specific) Friston et al, Neuroimage, 1997
Two mechanistic interpretations of PPI’s. Activity in region k Activity in region k Experimental factor Experimental factor Фk T Фk T + ФkxT + Фkx T Response in region i =Фk + T + Фkx T Response in region i =Фk + T + ФkxT Context specific modulation of responses to stimulus Stimulus related modulation of responses to context (attention) Friston et al, Neuroimage, 1997
PPI vs. correlation • Are PPI’s the same as correlations? • No • PPI’s are based on regressions and assume a dependent and independent variables (i.e., they assume causality in the statistical sense). • PPI’s explicitly discount main effects
PPI vs. correlations • Kim and Horwitz investigated correlations vs. PPI regression using a biologically plausible neural model. • PPI results were similar to those based on integrated synaptic activity (gold standard) • Results from correlations were not significant for many of the functional connections. • A change in influence between 2 regions may not involve a change in signal correlation Kim & Horwitz, Mag Res Med, 2008
PPI directionality ? • Although PPIs select a source and find target regions, they cannot determine the directionality of connectivity. • The regression equations are reversible. The slope of A B is approximately the reciprocal of B A (not exactly the reciprocal because of measurement error) • Directionality should be pre-specified and based on knowledge of anatomy or other experimental results. Source Target Source Target
PPI: notes • Because they consist of only 1 input region, PPI’s are models of contributions rather than effective connectivity. • PPI’s depend on factorial designs, otherwise the interaction and main effects may not be orthogonal, and the sensitivity to the interaction effect will be low. • Problems with PPI’s • Interaction term not formed correctly (as originally proposed) • Analysis can be overly sensitive to the choice of region.
Interaction term: first pass V1 x Attention xkxgp • Psychophysiological interaction term originally formed by multiplying measure BOLD signal by context vector (or by another BOLD signal in the case of physiophysiological interactions) Friston, et al. Neuroimage, 1997
Interaction term (revisited) • Regional activity measured as a BOLD time series = hemodynamic response neural activity • = convolution • Initial formulation of PPI estimated the interaction term as BOLD x context vector. • BUT: Interactions actually occur at a neuronal level! • Therefore neuronal activity must be estimated from hemodynamic activity • But, this is difficult because mapping from BOLD signal to neural signal is non-unique (due to loss of high frequency information) (Zarahn, Neuroimage, 2000)
BOLD vs. neural interactions yt = Measured BOLD signal h = hemodynamic (impulse) response function xt- = neuronal signal H = HRF in Toeplitz matrix form Gitelman et al., Neuroimage, 2003
Gitelman et al., Neuroimage, 2003
BOLD vs. neural interactions (example) Gitelman et al., Neuroimage, 2003
Deconvolution of BOLD signal • Can try using a maximum likelihood estimator (i.e., least squares) but this runs into trouble with high-frequency components. • Zarahn constrained the estimates to particular temporal intervals. (Zarahn, Neuroimage, 2000) • Can try using a Weiner filter, but this requires high SNR and an estimate of the noise spectral density. (Glover, Neuroimage, 1999) • Use empirical Bayes deconvolution to finesse the noise estimates by setting the prior precisions on the high frequencies to 0. (Gitelman, Neuroimage, 2003) Gitelman et al., Neuroimage, 2003
Deconvolution (effect of noise) Gitelman et al., Neuroimage, 2003
BOLD vs. neural interactions (effect of noise) BOLD Neural Gitelman et al., Neuroimage, 2003
BOLD vs. neural interactions (block design) Gitelman et al., Neuroimage, 2003
BOLD vs. neural interactions (event-related design) Gitelman et al., Neuroimage, 2003
• • • Task-driven lateralisation Does the word contain the letter A or not? letter decisions > spatial decisions group analysis (random effects),n=16, p<0.05 corrected analysis with SPM2 time Is the red letter left or right from the midline of the word? spatial decisions > letter decisions Stephan et al, Science, 2003
Bilateral ACC activation in both tasks –but asymmetric connectivity ! group analysisrandom effects (n=15) p<0.05, corrected (SVC) IFG Left ACC left inf. frontal gyrus (IFG):increase during letter decisions. left ACC (-6, 16, 42) letter vs spatialdecisions IPS spatial vs letterdecisions Right ACC right IPS:increase during spatial decisions. right ACC (8, 16, 48) Stephan et al., Science, 2003
PPI single-subject example letterdecisions spatialdecisions bVS= -0.16 bL= -0.19 spatialdecisions letterdecisions Signal in right ant. IPS Signal in left IFG bVS=0.50 bL=0.63 Signal in right ACC Signal in left ACC Left ACC signal plotted against left IFG Right ACC signal plotted against right IPS Stephan et al, Science, 2003
Interactions between the attentional and gustatory networks Veldhuizen et al., Chem Senses, 2007
Main effects: Detect tasteless – Passive tasteless Veldhuizen et al., Chem Senses, 2007
At a lower threshold (Punc = 0.005, influences were seen from FEF, PO and PPC on AI /FO. Veldhuizen et al., OHBM 2009
Physiophysiological interaction • Inkblot test • Common/frequent • Infrequent • Rare/unusual • Increased in schizophrenia and certain personality disorders • Associated with unusual perception and higher percentage of unusual responses in artistic populations. • Since amygdala activity can affect perceptual processing hypothesis is that amygdala is active during inkblot test. Asari et al., Psych Res, 2010 http://www.test-de-rorschach.com.ar/en/inkblots.htm
VBM demonstrated increased amygdala & cingulate volume in subjects with more unusual responses. Asari et al., Cortex, 2010
* • fMRI study responses to inkblot test • [unique – frequent]: temporal pole (p<0.05 corr), cingulate & orbitofrontal (p< 0.001 unc). • [frequent – unique]: occipitotemporal cortex • No amygdala responses (even when transient activity examined) • Temporal pole heavily connected to amygdala, and may access emotionally valent representations Asari et al., Neuroimage, 2008
Physiophysiological interaction • Temporal pole may link sensory input from occipitotemporal regions with top-down frontal control and emotional modulation by the amygdala Asari et al., Neuroimage, 2010
Pros & Cons of PPIs • Pros: • Given a single source region, we can test for its context-dependent connectivity across the entire brain • Simple to perform • Cons: • Very simplistic model: only allows modelling contributions from a single area • Ignores time-series properties of data (can do PPI’s on PET and fMRI data) • Inputs are not modelled explicitly • Interactions are instantaneous K. Stephan, FIL