
SlideServe
Menu
Préférences
© SlideServe · v2026

Magnification Factor

tamira avatar
7 diapositives · 409 Views · Jul 30, 2014

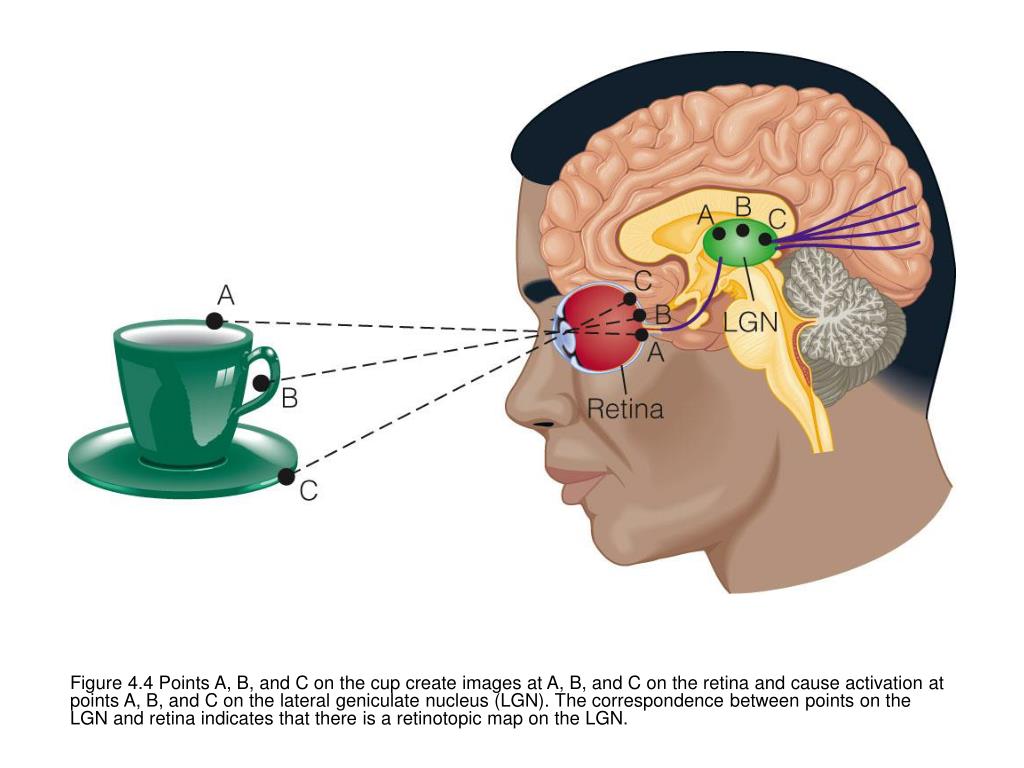
Figure 4.4 Points A, B, and C on the cup create images at A, B, and C on the retina and cause activation at points A, B, and C on the lateral geniculate nucleus (LGN). The correspondence between points on the LGN and retina indicates that there is a retinotopic map on the LGN.
Magnification Factor - slide 1
01 / 7Magnification Factor
1 / 17

Télécharger la présentation

Magnification Factor
Une image / un lien ci-dessous est fourni (tel quel) pour télécharger la présentation

Politique de téléchargement : le contenu du site vous est fourni TEL QUEL pour votre information et votre usage personnel ; il ne peut être vendu, concédé sous licence ni partagé sur d’autres sites sans l’accord de son auteur.Le contenu vous est fourni TEL QUEL, pour votre information et votre usage personnel uniquement. Téléchargez la présentation en cliquant sur ce lien. Lors du téléchargement, si vous ne parvenez pas à télécharger une présentation, l’éditeur a peut-être supprimé le fichier de son serveur.Pendant le téléchargement, si vous ne parvenez pas à obtenir une présentation, le fichier a peut-être été supprimé par l’éditeur.

F I N

Plus de contenu associé

Transcription de la présentation
  1. Figure 4.4 Points A, B, and C on the cup create images at A, B, and C on the retina and cause activation at points A, B, and C on the lateral geniculate nucleus (LGN). The correspondence between points on the LGN and retina indicates that there is a retinotopic map on the LGN.

  2. Figure 4.5 Retinotopic mapping of neurons in the LGN. The neurons at A, B, and C in layer 6 of the LGN have receptive fields located at positions A’, B’, and C’ on the retina. This mapping can be determined by recording from neurons encountered along an oblique electrode track. Also, neurons along a perpendicular electrode track all have their receptive fields on about the same place on the retina.

  3. Figure 4.13 Retinotopic mapping of neurons in the cortex. When the electrode penetrates the cortex obliquely, the receptive fields of the neurons recorded from the numbered positions along the track are displaced, as indicated by the numbered receptive fields; neurons near each other in the cortex have receptive fields near each other on the retina.

  4. Magnification Factor The apportioning of proportionally more space on the cortex to central vision (cones), compared to peripheral vision (rods). Figure 4.14 The magnification factor in the visual system: The small area of the fovea is represented by a large area on the visual cortex.

  5. Figure 4.22 Schematic diagram of a hypercolumn as pictured in Hubel and Wiesel’s ice-cube model. The light area on the left is one hypercolumn, and the darkened area on the right is another hypercolumn. The darkened area is labeled to show that it consists of one location column, right and left ocular dominance columns, and a complete set of orientation columns.

  6. Figure 4.24 How a tree creates an image on the retina and a pattern of activation on the cortex. See text for details.

  7. Figure 4.25 How the trunk of the tree pictured in Figure 4.24 would activate a number of different orientation columns in the cortex.