Download
1 / 40
400 likes | 491 Vues
Explore the impact of bottlenecks, drought, and oil price spikes on U.S. ethanol and agriculture, including projections and market interactions. Learn about production, prices, planting areas, and more.

E N D
Bottlenecks, Drought, and Oil Price Spikes: Impact on U.S. Ethanol and Agriculture Chad Hart Center for Agricultural and Rural Development Iowa State University chart@iastate.edu 515-294-9911 Minnesota Economic Association, 2007 St. Paul, Minnesota October 26, 2007
Outline • Based on an update of our earlier study “Emerging Biofuels: Outlook of Effects on U.S. Grain, Oilseed, and Livestock Markets” http://www.card.iastate.edu/publications/synopsis.aspx?id=1050 • Updated with available 2006 and 2007 data • The objective is to estimate: • how large the biofuels sector in the U.S. could become • the impact of the biofuels sector on crops markets, trade, and on livestock markets • the response of world agricultural markets
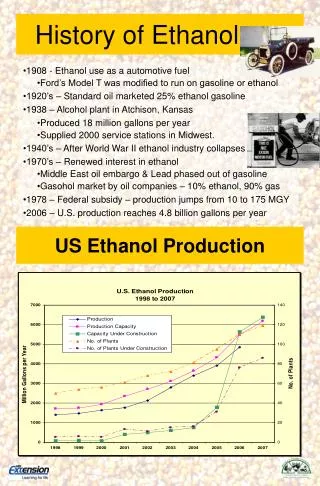
U.S. Ethanol Industry • Current ethanol capacity: 131 plants, 6.92 billion gallons/year • Total capacity under construction and expansion: 6.56 billion gallons/year • 73 new ethanol plants and 10 expansion projects underway • 2.2 billion bushels of corn were used in producing fuel ethanol in 2006/2007 marketing year. • 3.2-3.5 billion bushels of corn are expected to be used in producing fuel ethanolfor 2007/2008 marketing year.
Three Cases • Baseline • Current policies, “normal” weather • Higher oil prices throughout projection period • Adding $10/barrel to the crude oil price • Drought in the 2012 crop year • Placing a 1988-style drought in the middle of the projection period
Projected U.S. Ethanol Production Annual production based on Jan.-July 2007 numbers ~ 6.4 billion gallons
Impact of Higher Crude Oil Price • Increased crude oil price by $10/barrel over the projection • Margins on ethanol plants increase • New incentive to invest in added capacity for ethanol production • Eventually, a new equilibrium reached where there is no incentive to invest in or exit the ethanol industry • Will demand for ethanol be enough? • E-10 market will saturate around 15 billion gallons • Drop in ethanol price will eventually encourage increase in demand for the flex-fuel cars
Impact on Rest of the World • World grain and oilseed prices increase • Result in higher feed and food prices • Higher livestock production cost • Countries in South America and Asia fill the crop gap
Impact of Short Crop Scenario • Drought in 2012 similar to 1988 • Regional yields of corn, soybeans and wheat changed from trend levels • Yields were off by 25% for corn, 18% for soybeans, and 11% for wheat in 1988 • Ethanol mandate for 2012 assumed to be 14.7 billion gallons
Corn, Soybean and Ethanol Markets • Corn price increases by 44% above baseline levels • Soybean price rises by 22% • Corn exports and stock levels decline by more than 60% • Corn exports from South America, China, etc. fill part of the gap from decline in U.S. corn exports • Corn feed use declines by 16% (switch to other feeds) • Ethanol trade increases moderately
Livestock Market • Higher feed costs affect the livestock sector but to a lesser extent as shock is perceived as temporary • Production declines • Broiler production declines the most (over 2.5%) • Milk production declines the least (0.5%)