GEOGLAM phased approach
260 likes | 466 Vues
GEOGLAM phased approach . Context for GEOGLAM. Monthly Wheat Prices 1960-2011($/ Metric Ton) Source: World Bank. 2008 Price hikes Droughts: Australia & Ukraine. NASA/USDA/NOAA AGRISTARS. 2010/11 Price hikes Drought: Russia. 1971/2’s price hike Drought: Russia .

GEOGLAM phased approach
E N D
Presentation Transcript
Context for GEOGLAM Monthly Wheat Prices 1960-2011($/Metric Ton)Source: World Bank 2008 Price hikes Droughts: Australia & Ukraine NASA/USDA/NOAA AGRISTARS 2010/11 Price hikes Drought: Russia 1971/2’s price hike Drought: Russia Landsat 1 Launched (1972) Nominal wheat price in US $/metric Ton
Need for Improved Agricultural Intelligence International recognition of critical need for improved information including at the World Summit on Food Security 2009, G20 Action Plan on Food Price Volatility and Agriculture, 2011 official statement of The Extraordinary Joint Intersessional meeting of the Intergovernmental Group (IGG/FAO) on Grains, Rome 2010: “Unexpected price hikes and volatility are amongst major threats to food security and their root causes need to be addressed, in particular regarding the lack of reliable and up-to-date information on crop supply and demand and export availability….”
The G20 Initiative: GEOGLAM • The G20 Cannes Summit (November 2011) Action Plan on Food Price Volatility and Agriculture • Reaffirmed GEOGLAM commitment at the 2012 G-20 Los Cabos Declaration & in Agriculture Ministers Report
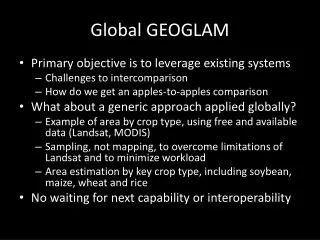
G20 GEOGLAM Goal: To strengthen the international community’s capacity to produce and disseminate relevant, timely and accurate forecasts of agricultural production at national, regional and global scales through the use of EO Outcome: an improved and more harmonized systems of systems taking advantage of new satellite assets and methods and a higher level of international coordination • GEOGLAM is implemented in the framework of GEO
GEOGLAM steering Committee Including G20 Donor representation, program Stakeholders Program coordinator and coordination office Implementation Committee Global/Reg Imp Team National CAP Imp Team Countries-at-risk Imp Team Main Prod/commodities EO Agric. monitoring Food Sec Assessment EO data coordination Imp Team R&D coordination Imp Team Data Products and Information Imp Team
Organization and Roles • Steering Committee • Stakeholder Program Steering and Donor Coordination • Program Coordinator (Secretariat at the GEOSec) • Program coordination, fund raising and management, program reporting and outreach • Ex Officio member of the Steering Committee • Implementation Committee • Coordination across Implementation Teams • Reporting to and discussion with the SC on progress and future developments • Coordination with AMIS and other Partner programs • Implementation Teams • representation from the individual project/ activities • Projects w. Project Leads • projects contributing to meeting the GEOGLAM goals
Phased implementation across all components • Phase 1 (P1) 2012-2014 Foundation Activities • Build on existing activities • Initiate Pilot Projects • Phase 2 (P2) 2014 – 2016 Review and Expansion • Continue/Complete Phase 1 Activities • New Starts • Phase 3 (P3) 2015- 2017 Pre-Operational • Completion of Phase 1 / 2 Projects • Geographic Expansion • Operational Phase 2017 >
Component 1 Phase 1 (2012-2103) Crop Condition Global Outlook: Building International Consensus Assessment of Crop Conditions in Northern Hemisphere- input to AMIS Canada Russia Ukraine Kazakhstan Russia, Orenburg USA Spring Wheat Spring Wheat Spring Wheat Winter Wheat/ Corn Corn/ Soy China anomaly anomaly anomaly India anomaly Non Cropland Not shown anomaly Crop NDVI Anomaly NDVI -0.4 0 0.4 normal Worse than normal Better than normal Current season crop development (2012) Crop NDVI Anomaly, August 13th, 2012 Average season development (2000-2011)
Component 1 - Phase 1 : N. Hemisphere Crop Outlook for AMIS 2012 Crop Condition July 17, 2012 Russia Production 38MT = 32% Ukraine Production 15.5 MT = 30% Kazakhstan Production 10.5 MT = 53% 2012 drought affecting crop production in Russia, Ukraine, Kazakhstan Comparing the 2012 Black Sea Region Drought to the 2010 Drought Crop Condition During the 2010 Russian Drought: (July 17 2010) Vegetation Anomaly during the 2010 Russian drought, when grain production decreased by 30% and wheat prices rose over 80% in 6 months
Component 1 Phase 1:Tools and Capacity Enhancement Transferring JRC MARS Monitoring Capabilities to FAO GIEWS
Component 1 Phase 1: Baseline Data Sets Current Cropland Distribution: best available from existing satellite-derived sources Source: IIASA, Fritz et al. Beta Version 1
GEOGLAM ‘Capacity Building’ Generic Enhancement Process Step 1. Regional Status Assessment, Needs and Priorities Workshop Step 2. National Engagement / Commitments – interested parties Step 3a. National Implementation Step 3b. Regional Training / Information Exchange and continued regional networking Linkages & feedback between the global/regional monitoring systems and activities
Component 3 Phase 1: Data Sets and Data Gap Definition Countries at Risk Phase 1: 2013-2014 Data Sets • FEWS NET Global gridded rainfall • FEWS NET MODIS ET • FAO Agricultural Stress Index Data Gaps • FEWS NET/WMO/GEO Workshop with East Africa National Met Services Coordination • CRAM IV Workshop Sub-Saharan Africa (JRC/FAO/FEWSNET)
Component 3 Phase 1: Data Sets and Data Gap Definition Evapotranspiration Anomalies
Information Products Identifying Information and Product Types EO Data Products • Crop outlook / Early warning • Area estimate • Yield forecast • Production estimate • Food Sec/vulnerability report • Statistics reports • Cropland mask /Pasturelands • Ag practices • Crop condition indicators • Crop type • Biophysical variables • Environmental variables (soil moisture) • In-situ Weather
Component 4 Phase 1: Developing GEOGLAM Acquisition Strategy Missions and Instruments These tables represent candidate GEOGLAM missions. The phased implementation approach will evaluate the utility and need of each dataset to develop long-term plans.
Component 4 Phase 1: Data Acquisition Proposed GEOGLAM Phased Approach • Phase 1: Demonstration & Early Feasibility Phase (Nov2013 – Nov 2014 ) • Developing requirements approach & strategy • Development of baseline datasets • Focused on 5 countries 1 Region (4 large producer, 2 ‘at risk’) • Initial volumetric assessments • Focus on available Optical and SWIR Regional SAR (Asia Rice) • Phase 2: Assessment & Expansion (March 2014 – November 2015) • Pilot global sampling strategy for the main producers • New countries (~ 5) • New missions (Global SAR & sentinels) • Sampling strategy for at risk region- initiated • Phase 3: Pre-Operational (March 2015 - November 2017) • Expand to all large producer countries (global producer sampling) • 3-5 At risk countries TBD • New missions acquired and new products • Validation/evaluation • Phase 4: Operational (Begins Nov 2017) • Hand-off from CEOS to GEOGLAM
Component 4 Phase 1: Pilot Study on Data Interoperability Sentinel-2A and 2B - LDCM Europe Longitude: 1.4 34.6 Latitude: 44.4 51.6 NASA, CESBIO, ESA The large number of blue colored bands (>41 accesses) indicate that the revisit interval over the majority of the region is on the order of 2 days. • The picture shows the number of times LDCM and the Sentinel 2 satellites accessed areas on the ground over an 80 day period of time. • 21 accesses indicates a maximum revisit interval of ~3 days 19 hours • 46 accesses indicates a minimum revisit interval of ~1 day 18 hours
Examples of Phase 1 Support: Current & Potential Canada JECAM office • US NASA • Global Soy Area Estimation • GEOGLAM operations • Drought monitoring system prototype • Wheat Yield Forecasting prototype USDA • Pakistan Capacity Building • GLAM Operation w. NASA • Japan: • Asia Rice Initiative (ADB) • China: • GEO Agriculture- MOST, indication will support GEOGLAM next year • EU FP 7 • 9 Million Euro Call in Process • France • GEOGLAM operations- secondment of project coordinator • Gates Foundation • Indicated interest in supporting Africa capacity building activities • Germany • Indicated interest to support GEOGLAM • Argentina (Ministry of Ag) • National capacity building initiative • Mexico (SIAP) • National capacity building initiative
Component 5 Phase 1: Method Intercomparisons • JECAM activities are being undertaken at a series of study sites which represent many of the world’s main cropping systems • 15 sites currently exist, at least 5 new in development, 3 dormant Sites in development
Logic for GEOGLAM Funding (2012) In parallel: • Setup GEOGLAM Secretariat (at GEO Sec Geneva) with internationally seconded staff • Build on national contributions from current or new projects • When Secretariat is in place initiate budget program/proposal development and fund raising activities • Focus on building early demonstrations of success in each component (in process). Design the new P2-P3 activities with associated funding