Download
1 / 18
190 likes | 289 Vues
Learn about atmospheric evolution, layers, climate factors, ozone hole, seasonal changes, and global air circulation in this comprehensive guide.

E N D
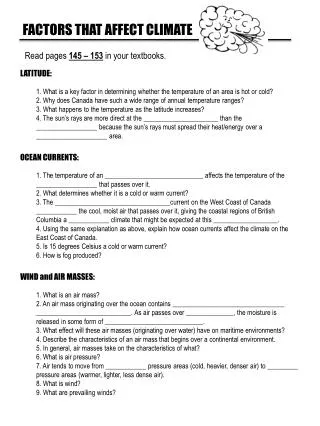
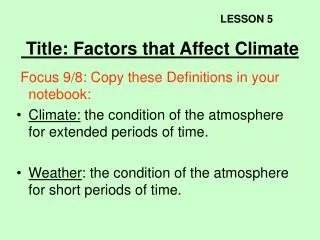
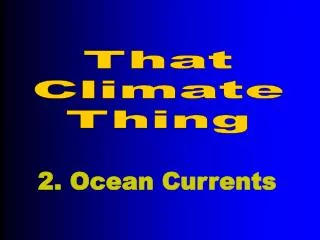
That Climate Thing 1. Atmospheric Circulation
Atmosphere is the Earth’s 110 km thick gaseous envelope, and evolved in three stages: 4-4.5 Ga agodominantly H, He (much like Jupiter, Saturn and Sun) 3.5 Ga ago changed to mostly C, N and O when the first oceans appeared 1.25 Ga agobecame mostly N and O, as at the present time, because of loss of C. Exosphere 400 km altitude Thermosphere Mesosphere Stratosphere Troposphere 300 km 50 km 40 km 10 km Where did this atmospheric CO2 go? It ended up in the oceans. How? Because of photosynthesis.
Troposphere • extends to 16-18 km above the tropics but <10 km above the poles; • contains ~80% of atmosphere’s mass; and • runs the hydrological cycle because tropo-spheric temperatures decrease with height. Average atmospheric temperature Thermo-sphere Mesopause There is a hole in the Ozone layer right above Antarctica Mesosphere Height, above mean sea level (km) Stratopause Stratosphere Tropopause Troposphere Average temperature, °C What if the tropo-spheric temperature gradient changes? Why is ozone good overAntarctica but bad over Southern California?
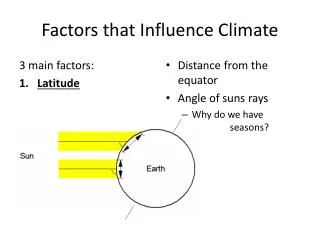
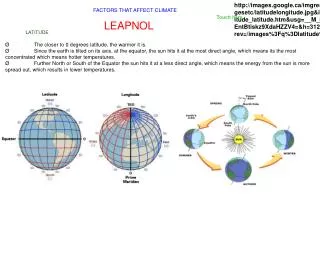
Sun is so far that we can assume Sun’s rays striking the Earth’s surface to be parallel. Because of the curvature of Earth’s surface, then, solar heat input varies with latitude. Same input Tropics thus receive most solar heat per unit area and the polar region the least.
Why seasons? Earth's spin axis tilts 23.5° from the vertical. Thus, as Earth completes is orbit, North pole tilts towards the Sun one-half the time, with peak at the Summer Solstice, whereas South pole tilts towards the Sun during the other half, with peak at Winter Solstice. Tropics, bounded by Tropic of Cancer (23.5°N) and Tropic of Capricorn (23.5°S), receive Sun all year round and therefore have no seasons, whereas temperate latitudes have seasons. Also, the northern temperate region (23.5°N to 66.5°N or the Arctic Circle) has summer when the southern temperate region (23.5°S to 66.5°S or the Antarctic Circle) has winter, and vice versa. What if Earth's spin axis became nearly vertical, as is the case with Venus? Will we still have the seasons? What if Earth's spin axis became vertical, much like what exists on Venus? Will we still have the seasons?
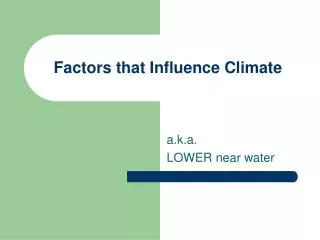
A general model of tropospheric circulation 3 forces govern this circulation: • Differential heating:Tropics receive most solar heat. • Differential gravity:Gravitational acceleration is most at the poles, least at the equator. • Differential rotation:Equatorial surface wind blows to the west, against the direction of Earth’s spin.
Rotation has consequences for WeatherBecause of rotation, surface air blows increasingly to the west the closer we approach the equator. This is Coriolis effect and is demonstrated in the following animation. 60° N 30° N 0° 30° S 60° N
Satellite images of particles (aerosols) in the atmosphere are one way to illustrate the path of global atmospheric circulation. The animation below shows daily global images of the Total Ozone Mapping Spectrometer (TOMS) aerosol index indicating the location of UV-absorbing tropospheric aerosols from July through September, 1988. Here, light brown indicates the smallest amount of dust/smoke in the atmosphere, with dark brown indicating the largest amount. N W E S http://web1.umkc.edu/sites/env-sci/module4/weblab4.htm
http://ingrid.ldgo.columbia.edu/maproom/.Global/.Climatologies/Precip_Loop.htmlhttp://ingrid.ldgo.columbia.edu/maproom/.Global/.Climatologies/Precip_Loop.html
Seasonal temperature variations can be explained in terms of the latitudinal and seasonal variations in the surface energy balance. The pattern of temperatures are a function of net short-wave radiation, net long-wave radiation, sensible heat flux, latent heat flux and change in heat storage. http://geography.uoregon.edu/envchange/clim_animations/
Precipitation-Evaporation (P-E) represents the difference between precipitation and evaporation http://geography.uoregon.edu/envchange/clim_animations/
Some implications • At 30°N/S latitudes, sea surface salinity tends to be high and deserts tend to cluster on land. • When equatorial surface wind blows to the west, it also stacks the warm surface waters to the west, so producing the E—W temperature differential that produces the hurricanes and cyclones that strike eastern margins of tropical/semitropical land.
Sea Surface Salinity http://www.scivis.nps.navy.mil/~braccio/images/S_big.gif
Deserts tend to cluster about 30º North and South latitudes, towards the western margins of land. http://pubs.usgs.gov/gip/deserts/what/world.html
Tropical cyclones develop in the hot, humid air over a sea surface exceeding 26°C in temperature.
Hurricanes typically occur on our Atlantic coast and originate farther to the east, as can be seen in this animation of Hurricane Katrina.