Representing Functions
90 likes | 246 Vues
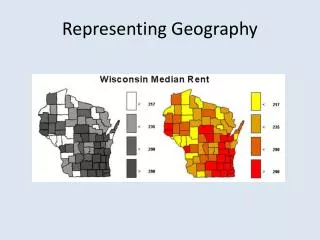
Representing Functions. Section 9-1. Function Vocabulary. Outputs Dependent Range Y-value. Inputs Independent Domain X-value. Translating between Reps. Table Find finite differences (ratios) to find rate-of-change (slope). Graph points as ordered pairs and look for patterns. Graph

Representing Functions
E N D
Presentation Transcript
Representing Functions Section 9-1
Function Vocabulary • Outputs • Dependent • Range • Y-value • Inputs • Independent • Domain • X-value
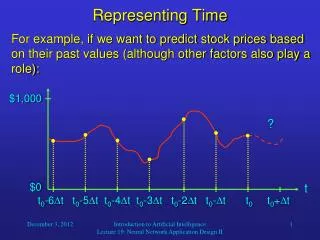
Translating between Reps • Table • Find finite differences (ratios) to find rate-of-change (slope). • Graph points as ordered pairs and look for patterns. • Graph • Identify key points to help write an equation. • Create a table from several points (ordered pairs). • Use slope and intercepts to write a verbal description.
Translating between Reps • Equation (Use your calculator.) • Make a table of values. • Make a graph. • Verbal Description • Identify independent and dependent variables and write an equation. • Generate a table of values from the pattern. • Sketch a graph.
Example • An amusement park manager estimates the daily profits by multiplying the number of tickets sold by 20. • Profits equal x times 20 • p = 20t • y=20x
Practice Problem • Kurt is rappelling down a 500-foot cliff at a rate of 6 feet per second. • Create a table, equation and graph to represent Kurt’s height relative to the ground. • When will Kurt reach the ground?
Homework • Pg. 80: #1, 2, 3, 11, 12, 13, 19-22 • Pg. 659: #11