Download
1 / 1
10 likes | 65 Vues
Explore how satellite and GIS data are utilized in the kNearest Neighbors approach to improve forest inventory precision and operational forest maps. Early results and methodologies are discussed.

E N D
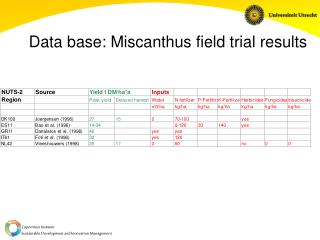
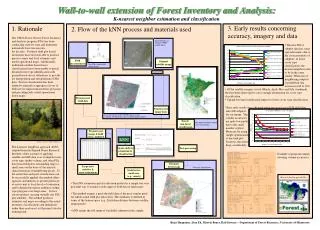
Research funding provided by: Wall-to-wall extension of Forest Inventory and Analysis: K-nearest neighbor estimation and classification 3. Early results concerning accuracy, imagery and data 1. Rationale 2. Flow of the kNN process and materials used The USDA Forest Service Forest Inventory and Analysis program (FIA) has been conducting state-by-state and ultimately nationwide forest inventories for decades. Yet these field plot based inventories have not been able to produce precise county and local estimates and useful operational maps. Additionally, traditional satellite-based forest classifications have been unable to match detailed forest type identification with ground based survey definitions to provide for interpolation and extrapolation of FIA data. Precise classification has been limited to general or aggregate classes of little use for improving inventory precision and providing truly useful operational forest maps. The k-nearest neighbors approach (kNN), adapted from the Finnish Forest Research Institute, offers a means of applying satellite and GIS data so as to impute forest cover type, timber volume, and other FIA data from field plots surrounding large or small areas on the basis of the spectral characterization of neighboring pixels. To the extent that such post-stratification can be successfully applied, the method offers agencies and industry a) greater precision at survey unit to local levels of estimation, and b) detailed inventory attributes within type polygons over large areas. In fact, our researchers can map virtually any FIA plot attribute. The method produces estimates and maps according to the actual inventory classifications and definitions rather than an abstract set that must later be reinterpreted. Spectral band 1 of Landsat 7 ETM+ satellite image • The new FIA 4-subplot data has some special features due to the close proximity of subplots; in forest cover type classification, the nearest neighbors tend to be in the same cluster. When use of neighboring subplots is prohibited, the accuracies fall to 30% Field measurements Original satellite image New FIA 4-subplot field cluster design Preprocessing • Of the satellite imagery tested (March, April, May and July combined), the first three dates tend to carry enough information for cover type classification • Upland-lowland stratification improves forest cover type classification Preprocessed field data These early results were obtained using one year’s set of FIA field data, Preprocessed image data only 696 subplots for our image. The volume accuracies are quite low partly due to the small number of plots. However, by using simple optimization of the field plot locations, the errors drop considerably. A georeferenced Landsat 7 ETM+ image, clouds excluded. The black dots represent FIA field plot clusters Forest/ non-forest stratification The Minnesota land use/land cover classification Preprocessed image & field data combined ‘kNN’ Photo courtesy of Dave Hansen Post-processing • Image analysis: • estimation & • classification DISTANCE: EUCLIDEAN WEIGHTING FUNCTION: NO WEIGHTS. NUMBER OF PLOTS: 696 NUMBER OF BANDS: 34 NUMBER OF NEIGHBORS: 1 VOLUME CROSS-VALIDATION RMSE (ALL) = 81.1354 m3 ,126.495 % VOLUME ALL MIN AND MAX =0 and 384.71 VOLUME ALL MEAN = 64.1413 VOLUME STANDARD DEVIATION (ALL) = 70.0947 VOLUME BIAS (ALL) = -1.40832 Class\Ref 0-40 41-80 8 1-120 121-160 >160 User’s acc 0-40 217 54 35 12 23 0.6363 41-80 47 35 17 16 10 0.28 81-120 40 14 24 12 15 0.2285 121-160 15 20 13 7 8 0.1111 >160 17 10 9 11 15 0.2419 Prod.acc 0.645833 0.263158 0.244898 0.12069 0.211268 -------------------------------------------------------------------- VOLUME CROSS-VALIDATION RMSE (LOWLAND) = 66.624 m3 ,154.966 % NUMBER OF PLOTS (LOWLAND) = 164 VOLUME LOWLAND MIN AND MAX = 0 and 254.07 VOLUME LOWLAND MEAN = 42.9926 VOLUME STANDARD DEVIATION (LOWLAND) = 53.712 VOLUME BIAS (LOWLAND) = -2.87561 Class\Ref 0-40 41-80 8 1-120 121-160 >160 User’s acc 0-40 82 8 12 3 5 0.7454 41-80 7 7 3 0 1 0.3888 81-120 9 4 6 3 1 0.2608 121-160 4 0 2 0 0 0 >160 4 1 1 0 1 0.1666 Prod.acc 0.773585 0.350 0.250 0.000 0.125 -------------------------------------------------------------------- VOLUME CROSS-VALIDATION RMSE (UPLAND) = 86.8592 m3 ,122.924 % NUMBER OF PLOTS (UPLAND) = 532 VOLUME UPLAND MIN AND MAX = 0 and 384.71 VOLUME UPLAND MEAN = 70.6608 VOLUME STANDARD DEVIATION (UPLAND) = 73.2422 VOLUME BIAS (UPLAND) = -0.0196241 Class\Ref 0-40 41-80 8 1-120 121-160 >160 User’s acc 0-40 134 42 23 9 20 0.5877 41-80 42 29 13 16 7 0.271 81-120 27 14 20 9 13 0.2409 121-160 12 18 11 7 9 0.1228 >160 15 10 7 11 14 0.2456 Prod.acc 0.582609 0.256637 0.27027 0.134615 0.222222 Example of program outputs showing volume accuracies Thematic forest maps Large-area statistics & error estimations Cover type classification Statistics for small area (e.g., county) • The kNN estimation and classification method is a simple, but very powerful way to extend a wide range of field data to landscapes • The method assigns a pixel the field data of the most similar pixel, for which actual field plot data exists. The similarity is defined in terms of the feature space (e.g., Euclidean distance between satellite image pixels) • kNN retains the full range of variability inherent in the sample Reija Haapanen, Alan Ek, Marvin Bauer, Kali Sawaya -- Department of Forest Resources, University of Minnesota