Download
1 / 20
200 likes | 432 Vues
Field inspection survey in 2007. Krasimira GALABOVA GeoCAP, JRC Ispra. Outline. Purpose: comparison between the cost for classical Field Inspection (FI) and OTS carried out by Control with Remote Sensing (CwRS) Field inspection survey data Results of the FI survey. Need of FI survey.

E N D
Field inspection survey in 2007 Krasimira GALABOVA GeoCAP, JRC Ispra
Outline • Purpose:comparisonbetween the cost forclassical Field Inspection(FI)and OTS carriedout byControl with Remote Sensing (CwRS) • Field inspection survey data • Results of the FI survey
Need of FI survey • OTS controls~7 %of all claims at EU level performed either using classical FI or CwRS: • In 2001 total number of RS checks in EU 15 over the total number of OTC checks CwRS - 61% • In 2007 - 51% but EU 27, 2008 - 54% and 2009 - 61% Why do MS use CwRS? Pro & cons: + Focus inspection to problem claims / parcels - Less flexible in space (restricted to zones defined at campaign start, poorer risk analysis?); cannot replace field visit for particular checks (AEM, LFA,…) + Is CwRSfaster,cheaper?-> object of survey
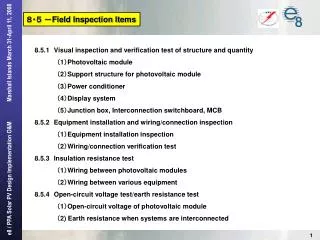
Field inspection survey • Request sent to 27 MS • Data sent back by14 MS, complete in 9 MS: BE WA, BE FL,CZ,EE,ES, GR,IT, LT, NL, PL, SI, SK, UK EN, UK WA Data collected • Total number of OTS checks in 2007, total claimed area checked • Area of farms field inspected
Data collected • Number of FI • Number of farms checked with RS • Number of farms followed up in the field • Average number of days for FI • Period over which FI were carried out • % of parcels checked in the field • Mean number of parcels, mean area of farms FI • Average cost per farm field inspected and RS
Difficulties Difficulties from MS to separate costs of RS and FI and provide data: • number of parcels inspected in SK, UK EN--> use of CwRS sum stats • number of days for FI (CZ, BE WA) • cost of CwRS and follow up checks (LT)
Classical Field Inspection (FI) versus CwRS (% of total OTS checks) All data provided by MS
Cost of classical field inspection and CwRS per farm in Euro > 1000 € RS cheaper than FI in all MS Large range of FI cost - Why? FI < 80 € RS FI: from 75 to 1065€ per farm, average ~ 380 € CwRS: from 30 to 250 per farm, average ~ 110 €
Are farms field inspected larger than farms checked with RS? From 7 to ~ 80 ha - FI RS > FI In 3 MS, farm larger on average in CwRS sample!
Potential factors explaining cost of FI • Farm area • Number of parcels • % of parcels inspected • Number of days • Cost of inspector’s day Some of these factors may be correlated!
FI cost increases with mean farm area UK EN BE FL Cost, € BE WA IT PL EE SL NL LT Farm area (ha)
FI cost increases with number of parcels per farm UK EN Cost, € Be WA Mean number of parcels per farm (ha)
FI cost increases with number of inspection days BE FL Cost, € BE WA EE SI Mean number of inspection days per farm
FI increases with % of parcels checked in the field by inspector % ranges from 50% (i.e. regulation minimum, increased in case of discrepancy found) – LT, PL, SI?, NL, BE, EE to 100% - UK EN Min 50% Cost, € % of parcels checked
Model predicting FI cost FI Cost = 9,5 farm area + 8,0 nb parcels + 4,6 nb days + 4,35 % parcels checked – 332 R2 = 0.83 -> factors used are good predictors of the Cost of FI
Predicted by the model cost vs real FI cost FI cost Predicted FIcost
Ratio cost of field inspection / cost of CwRS per dossier checked Average ratio ~ 4 2 groups of MS: BE / NL, EE, PL, IT, LT, SI, UK EN Why in BE ratio > 10 and in NL, EE, PL ratio < 2 ? The higher the ratio, the higher the cost efficiency of CwRS!
Reason for variability in ratio cost (field inspection / CwRS) • High difference (CwRS relatively cheaper than FI) expected where CwRS does not include FV: UK EN - ratio of 4 • Low difference in cost (low ratio) expected in MS where CwRS includes 100% field visits : PL, EE, BE • Case of PL: ratio of 2, CwRS saving on area measurement (2days / 189€) • But not case of BE Wa (ratio of 13) Same ratio in BE FL (ratio of 12) In both regions, high number of days of FI
Conclusions • Average cost of FI for 1 day ~ 180€ • The most important factor to explain FI cost is farm area(correlated – on this data set – with number of parcels per farm) • Field Inspection costs on average ~ 4 times more than CwRS • Large differences of ratio between FI and RS costs: ratio ranges from 1 to 13. Reason not yet fully understood! • Cost of imagery not taken into account (could be useful if one day the Commission stops financing of RS imagery, anyway images will be nearly free in 2025)
Thank you • To MS that gave this sensitive data! Question: Should we hide reference to MS in public ppt? • If More MS want to participate…