Download
1 / 6
70 likes | 150 Vues
This study presents a novel approach to predicting solar extreme events in 2005 by utilizing Singular Spectrum Analysis (SSA) and Neurofuzzy Models. The methodology involves locally linear models and the LOLIMOT algorithm, integrating time series analysis and machine learning techniques for accurate forecasts. Figures illustrate the process, showing the steps involved in model refinement and prediction generation. The application of SSA+LOLIMOT results in successful one-step predictions of proton density during significant solar events in May and July 2005.

E N D
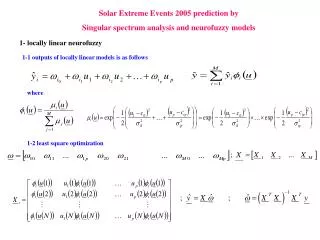
Solar Extreme Events 2005 prediction by Singular spectrum analysis and neurofuzzy models 1- locally linear neurofuzzy 1-1 outputs of locally linear models is as follows where 1-2 least square optimization
Figure1- Illustration of LOLIMOT algorithm for two dimensional input space 2- Learning Algorithm: Locally Linear Model Tree (LOLIMOT) • 1- Start with an initial model: start with a single LLM, which is a global linear • 2- Find the worst LLM • 3- Check all divisions: The worst LLM is considered for further refinement. Divisions in all dimensions are tried, and for each of the divisions the following steps are carried out: • 3-1- Construction of the multi-dimensional membership functions for both generated hyper rectangles; • Construction of all validity functions. • 3-2- Estimation of the rule consequent parameters for newly generated LLMs. • 3-3- Calculations of the loss function for the current overall model. • 4- Find the best division: The best of the alternatives checked in step 3 is selected, and the related validity functions and LLMs are constructed. The number of LLM neurons is incremented. • 5- Test the termination condition: If the termination condition is met, then stop, else go to step 2.
3- Singular Spectrum Analysis 1- producing M-dimensional vectors from time series 2- covariance matrix is calculated as 3- corresponding principal component (PC) are: 4- time series is reconstructed by combining the associated principal components:
Figure2-Block Diagram of SSA+LOLIMOT method for time series prediction 4- SSA+LOLIMOT method M principle component extracted and then for each PC a LLNF model should train; then next value prediction of each PC obtained; finally predicted PCs combined for achievement to prediction of main series.
5- Proton Events 2005 prediction Figure3- one-step prediction of proton density with LOLIMOT+SSA method: (a)-16 July; (b)-7 May 2005