Download
1 / 20
210 likes | 736 Vues
DEVELOPMENT OF STORM SURGE HAZARD MAPS AND ADVISORY SYSTEM FOR THE PHILIPPINES.

E N D
DEVELOPMENT OF STORM SURGE HAZARD MAPS AND ADVISORY SYSTEMFOR THE PHILIPPINES Joy Santiago(1,2), Alfredo Mahar Francisco Lagmay(1,2), Vicente Malano(3) Carl Vincent Caro(1,2), John Kenneth Suarez(1), Judd Tablazon(1), Lea Dasallas(1), and Prince Garnet Goting(1) Nationwide Operational Assessment of Hazards, Quezon City, Philippines, University of the Philippines - Diliman, Quezon City, Philippines, and Philippine Atmospheric, Geophysical and Astronomical Services Administration EUROPEAN GEOSCIENCES UNION GENERAL ASSEMBLY 2016 VIENNA, AUSTRIA | APRIL 18-22, 2016
Development of Storm Surge Hazard Maps and Advisory System for the Philippines The Philippines experiences an average of 20 tropical cyclones annually. Strong winds brought by tropical cyclones, among other factors, cause storm surges that inundate the coastal areas of the country. As an archipelago with the fourth longest coastline in the world, the country is expose to the threats of storm surges. This was manifested by Typhoon Haiyan on 8 November 2013, which devastated the country and left 6,293 deaths and approximately USD 2 billion worth of damages. To prevent such disaster from happening again, the Nationwide Operational Assessment of Hazards (Project NOAH) developed a Storm Surge Advisory (SSA) that aims to warn communities in coastal areas against impending floods due to storm surges. The Japan Meteorological Agency storm surge model was used to simulate 721 tropical cyclones that entered the Philippine Area of Responsibility from 1951-2013. The resulting storm surge time series from the simulations were added to the maximum tide levels from the WXTide software for the 4,996 observation points placed nearshore in the entire country. The storm tide levels were categorized into four groups based on their peak height to create the SSA – SSA 1 (0.01m to 2m), SSA 2 (2.01m to 3m), SSA 3 (3.01m to 4m), and SSA 4 (4m and above). The time series for each advisory level was used in inundation modelling using FLO-2D, a two-dimensional flood modeling software that uses continuity and dynamic wave momentum equation. Best Track Storm Surge Hazard Maps Surge Map Adapted from: JMA Storm Surge Model Higaki, M. Office of Marine Prediction JMA Time Series Storm Surge Model Summary (1) Bathymetry
Development of Storm Surge Hazard Maps and Advisory System for the Philippines The SSA hazard maps are used as reference to warn communities that are likely to be affected by storm surges. Advisory is released 24 hours in advance and is updated every six hours in the Project NOAH website. It is also being utilized in the pre-disaster risk assessment of the national government agencies and local government units in designing appropriate response to impending threats and risk brought by natural hazards. Forecasting and Advisory System Last December 2014, the country was ravaged by Typhoon Hagupit. Around 200 houses were destroyed by storm surges in the municipality of Babatngon, Leyte. Project NOAH released a storm surge advisory for the area based on their December 5, 5:00 am forecast, in which sorm surges were predicted to reach up to four meters. Summary (2)
DEVELOPMENT OF STORM SURGE HAZARD MAPS AND ADVISORY SYSTEMFOR THE PHILIPPINES Joy Santiago(1,2), Alfredo Mahar Francisco Lagmay(1,2), Vicente Malano(3) Carl Vincent Caro(1,2), John Kenneth Suarez(1), Judd Tablazon(1), Lea Dasallas(1), and Prince Garnet Goting(1) Nationwide Operational Assessment of Hazards, Quezon City, Philippines, University of the Philippines - Diliman, Quezon City, Philippines, and Philippine Atmospheric, Geophysical and Astronomical Services Administration EUROPEAN GEOSCIENCES UNION GENERAL ASSEMBLY 2016 VIENNA, AUSTRIA | APRIL 18-22, 2016
Development of Storm Surge Hazard Maps and Advisory System for the Philippines The Philippines experiences an average of 20 tropical cyclones annually. Strong winds brought by tropical cyclones, among other factors, cause storm surges that inundate the coastal areas of the country. As an archipelago with the fourth longest coastline in the world, the country is expose to the threats of storm surges. This was manifested by Typhoon Haiyan on 8 November 2013, which devastated the country and left 6,293 deaths and approximately USD 2 billion worth of damages. To prevent such disaster from happening again, the Nationwide Operational Assessment of Hazards (Project NOAH) developed a Storm Surge Advisory (SSA) that aims to warn communities in coastal areas against impending floods due to storm surges.
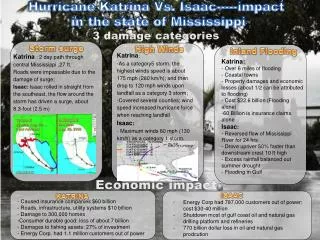
Development of Storm Surge Hazard Maps and Advisory System for the Philippines Storm surges is one of the reasons for the high number of casualties from the Typhoon Haiyan, especially in the provinces of Samar and Leyte. Image source: www.bbc.com
List of predicted storm tide levels for 68 coastal areas was sent to the Philippine National Risk Reduction and Management Council (NDRRMC) and the Office of Civil Defense (OCD)
Development of Storm Surge Hazard Maps and Advisory System for the Philippines Storm Surge Hazard Maps The Storm surge hazard maps and advisory of DOST-Project NOAH was developed as an early warning system in response to the Philippine government’s advocacy to eliminate the threat of storm surges to the country’s coastal communities. Forecasting and Advisory System
Development of Storm Surge Hazard Maps and Advisory System for the Philippines The storm surge hazard maps developed in the first process were used as reference to identify areas that will likely be affected by storm surges when there are tropical storm (TS) in the Philippine Area of Responsibility (PAR). The development of the advisory system is composed of two process namely (1) Creation of Storm Surge Hazard Maps and (2) Forecasting and Advisory System. 2 1 The team monitors tropical cyclone (TC) forecasts. If a TC becomes a TS, the team will simulate the storm surge model using forecasted meteorological data from JMA and/or Philippine Atmospheric, Geophysical and Astronomical Services Administration (PAGASA). 3 If the simulation results reveal a value of 1.5 meters or higher storm tide height, a storm surge advisory will be released. 4
Development of Storm Surge Hazard Maps and Advisory System for the Philippines Storm Surge Hazard Maps The Japan Meteorological Agency storm surge model was used to simulate 721 tropical cyclones that entered the Philippine Area of Responsibility from 1951-2013. The resulting storm surge time series from the simulations were added to the maximum tide levels from the WXTide software for the 4,996 observation points placed nearshore in the entire country. The storm tide levels were categorized into four groups based on their peak height to create the SSA – SSA 1 (0.01m to 2m), SSA 2 (2.01m to 3m), SSA 3 (3.01m to 4m), and SSA 4 (4m and above). The time series for each advisory level was used in inundation modelling using FLO-2D, a two-dimensional flood modeling software that uses continuity and dynamic wave momentum equation.
Development of Storm Surge Hazard Maps and Advisory System for the Philippines Storm Surge Hazard Maps A numerical storm surge model of Japan Meteorological Agency (JMA) was used in this study. It “utilizes two-dimensional shallow water equations consisting of vertically integrated momentum equations in two horizontal directions” (Higaki, Hayashibara, & Nozaki, 2009). Best Track Adapted from:JMA Storm Surge Model Higaki, M. Office of Marine Prediction JMA Storm Surge Model Surge Map Time Series Bathymetry
Development of Storm Surge Hazard Maps and Advisory System for the Philippines Storm Surge Hazard Maps Storm surge time series plots of all tropical cyclones that entered the PAR from 1951-2013. These were grouped per province and sorted into four classifications – those that produced storm surge heights of 0-2.00 meters, 2.01-3.00 meters, 3.01- 4.00 meters, and 4.01 meters and above. The time series plots in each classification were combined and processed to produce a single time series, which was used as an input for the inundation modelling.
Development of Storm Surge Hazard Maps and Advisory System for the Philippines Storm Surge Hazard Maps Flo-2D software was used in generating the inundation model for this study. It creates a detailed overland inundation map for ocean storm surge or tsunami hazards and is particularly effective in urban areas where buildings, obstructions, streets and channels can affect the flood wave progression (FLO-2D, 2015). To be able to create a storm surge inundation model, a wave height or water surface elevation as a function of time (time – stage data pairs) for the coastal grid elements is needed (FLO-2D, 2015). This input is the peaks created using the smoothing average technique. Maximum peaks were created for storm surge heights of 2, 3, 4, and 5 meters. Additionally, a Digital Terrain Model (bare earth) was used for this model. The input for this study was a 5-meter resolution IfSAR topographic data resampled to a 20-meter resolution.
Development of Storm Surge Hazard Maps and Advisory System for the Philippines The SSA hazard maps are used as reference to warn communities that are likely to be affected by storm surges. Advisory is released 24 hours in advance and is updated every six hours in the Project NOAH website. It is also being utilized in the pre-disaster risk assessment of the national government agencies and local government units in designing appropriate response to impending threats and risk brought by natural hazards.
Development of Storm Surge Hazard Maps and Advisory System for the Philippines Forecasting and Advisory System A storm surge forecasting protocol is followed when a tropical cyclone is about to enter the Philippine Area of Responsibility (PAR). Once the tropical cyclone is inside the PAR and is upgraded into a tropical storm or typhoon, the JMA storm surge model will be initiated. Model simulation is done every three hours using parameters from the Japan Meteorological Agency tropical cyclone warning. The outputs of the model are timeseries text files with storm surge heights over time. Tide data from WXTide software is added to produce storm tide (Tablazon, et al., 2015). The maximum storm tide for all the observation points is computed and the areas that are forecasted to experience at least two meters storm tide is included in the list that will be released in the DOST-Project NOAH blog.
Development of Storm Surge Hazard Maps and Advisory System for the Philippines Last December 2014, the country was ravaged by Typhoon Hagupit. Around 200 houses were destroyed by storm surges in the municipality of Babatngon, Leyte. Project NOAH released a storm surge advisory for the area based on their December 5, 5:00 am forecast, in which storm surges were predicted to reach up to four meters.
Development of Storm Surge Hazard Maps and Advisory System for the Philippines Inundation models usually takes time to be prepared and completed. When a tropical cyclone that can create storm surges threatens an area, probable effects must be delivered to disaster managers and local government units. If an inundation model for a tropical cyclone is created when the threat of storm surges is already imminent, it might be too late to reduce its impacts. The SSA maps provides a timely distribution of information that would allow disaster managers to create plans that would mitigate the storm surge impacts of a tropical cyclone. The use of SSA maps allows the disaster managers, local government units, media and the general public to assess the impacts of storm surges brought about by a tropical cyclone. The timely distribution and visualization of information brings about more “disasters that didn’t happen.”
Thank you. Joy Santiago Project NOAH +639274475862 joytoriolsantiago@gmail.com