Download
1 / 8
80 likes | 98 Vues
Learn to represent patterns, rules, and functions using words, tables, and graphs. Understand linear equations through plotting points in the coordinate plane, and analyze relationships between variables. Discover the key concepts of functions, domains, ranges, and graphing linear equations effectively.

E N D
4-6 Functions and Linear Equations (pg 177-181) Standard : PFA Indicator(s): P1: Represent patterns, rules and functions with words, tables, graphs, and variable expressions. P5: Recognize linear equations by plotting points in the coordinate plane P10: Analyze linear and non-linear relationships to show how changes in one variable results in the change of another
Vocabulary • Function- is an input/output relationship. You put a number in, perform the given function, and see what comes out. • Function table- a table that organizes the input and output for a function • Domain- the values that can go into a function (x) • Range- the values that come out of a function (y)
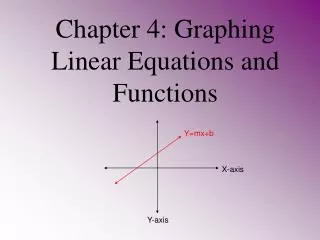
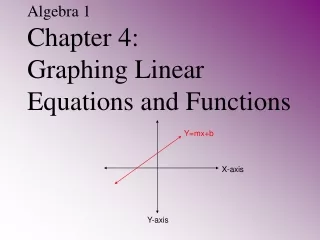
What is a linear equation? • A linear equation has a graph that is a straight line. • A linear equation looks like y=mx + b, where a and b are positive or negative numbers. • “m” represents the slope of the line (we will discuss this more in the next section) • “b” represents the y intercept (where the graphed line crosses the y axis)
Graphing a linear equation • Select a few values for x. • Substitute and solve for y. • Use each solution to write an ordered pair (x,y). 2 1 0 -1 (2) 5 (2,5) (1) 3 (1,3) 1 (0) (0,1) -1 (-1) (-1, -1)
Graphing a linear equation (continued) Plot the points for the (x,y) pairs. Draw a line through the points you graphed. Notice: the line crosses the y-axis at (0,1)
To which family do the following belong? y = 4x Exponential y = 3x +7 Linear y = Inverse y = 2x2 – 4 Quadratic