Download
1 / 10
100 likes | 109 Vues
Hurricane Irene August 28, 2011 NOAA/NHC Damage: #7 with >$ 16 Billion. Track Accurate; Intensity Over-predicted. Avila & Cangialosi , 2012, Tropical Cyclone Report. Hurricane Sandy October 29, 2012 NOAA/NHC Damage: #2 with >$ 68 Billion. Track Accurate;

E N D
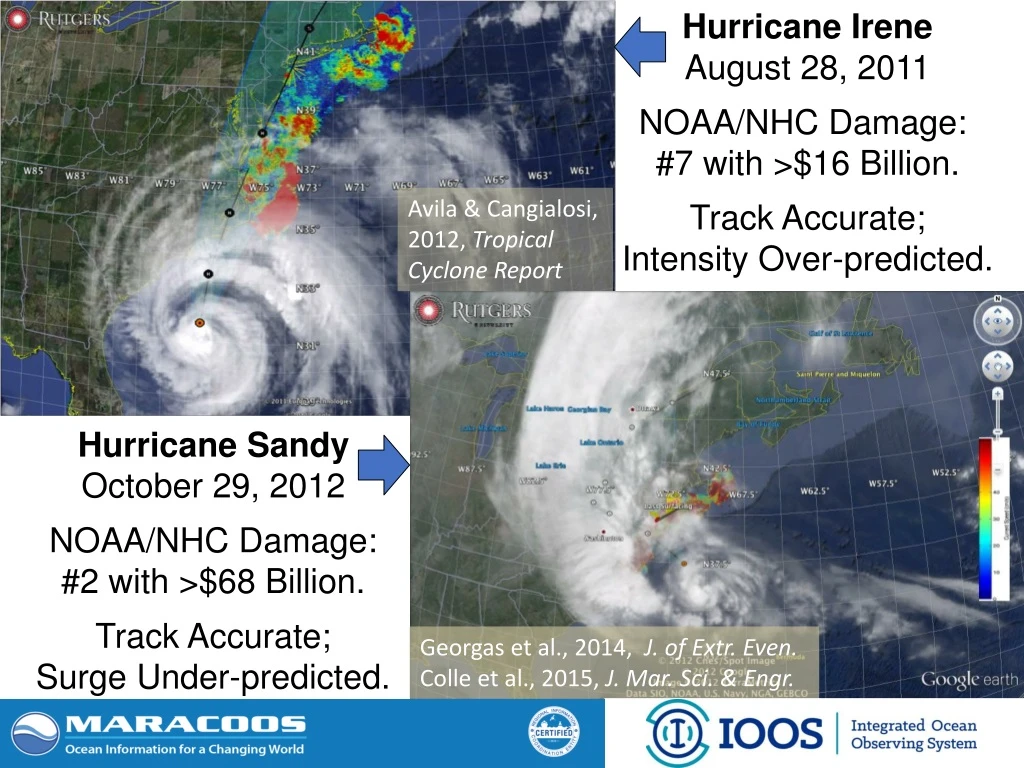
Hurricane Irene August 28, 2011 NOAA/NHC Damage: #7 with >$16 Billion. Track Accurate; Intensity Over-predicted. Avila & Cangialosi, 2012, Tropical Cyclone Report Hurricane Sandy October 29, 2012 NOAA/NHC Damage: #2 with >$68 Billion. Track Accurate; Surge Under-predicted. Georgas et al., 2014, J. of Extr. Even. Colle et al., 2015, J. Mar. Sci. & Engr.
Steady Improvement Intensity is modulated by the warm or cold ocean. Initial coupling to ocean models was not helping.
Tropical Cyclone Forecasting is a Global Issue for US Navy & NOAA Typhoon & Cyclone Damage measured in Deaths Hurricane Damage measured in Dollars Tropical Cyclone Tracks & Intensities Greatest Seasonal Cycle: China Korea Japan Greatest Seasonal Cycle: Mid-Atlantic Northeast Canada Summer – Winter Sea Surface Temperature Difference
Summer heating produces a highly stratified ocean - A warm surface layer + An unseen cold bottom layer Mid Atlantic Winter (1-layer) Mid Atlantic Summer (2-layers) Cold Pool Mid- Atlantic’s Cold Pool Yellow Sea’s Cold Bottom Water Mass Cold Bottom Water Mass Cold Bottom Water Mass Yellow Sea Summer Yellow Sea Summer Why unseen? Satellites cannot see below surface, Argo Floats do not extend into shallowwater
MARACOOS is Certified to Operate New Observing Technologies for US Government Slocum Underwater Glider for Sustained Subsurface Profiling of Temperature, Salinity, Currents, …. CODAR HF Radar for Current Mapping Glider Communicating at Surface Glider Profiling Subsurface
Operations to Research (O2R) Demonstrated Integrated Ocean Observatory identifies processes responsible for rapid ahead-of-eye cooling. Atmospheric model sensitivities identify ahead-of-eye cooling as the missing process for rapid de-intensification NOAA OAR
R2O - Hurricane Hermine Response - Glider Fleet Launched, 9/2016 Glider HYCOM RTOFS
R2O - Navy Global HYCOM: Temperature Below Summer Thermocline OpTest of GOFS 3.1 Operational GOFS 3.0 Well Defined Cold Pool No Cold Pool Sigma/Z-levels on Shelf Isopycnal Layers on Shelf
Oceanographers on the WRFIA hurricane team preparing the plan due April 2018 • Sentinel Storm Glidersdeployed as picket lines reporting subsurface ocean temperature profiles during hurricane season • Storm Glider Data Assimilation O2R2O cycle for the operational prediction models What is needed?