FACS Flow Cytometry Workshop
BIOPOLIS Flow Cytometry Facility. FACS Flow Cytometry Workshop. Biopolis Singapore 05 June 2007 John Daley john_daley@dfci.harvard.edu. Singapore 2007. Flow Cytometry and the FACSAria. Teaching a new dog old tricks. John Daley john_daley@dfci.harvard.edu. Basics of Flow.


FACS Flow Cytometry Workshop
E N D
Presentation Transcript
BIOPOLIS Flow Cytometry Facility FACS Flow Cytometry Workshop Biopolis Singapore 05 June 2007 John Daley john_daley@dfci.harvard.edu
Singapore 2007 Flow Cytometry and the FACSAria Teaching a new dog old tricks John Daley john_daley@dfci.harvard.edu
Basics of Flow (modern day alchemy) • Air • Fire • Water • INTELLIGENCE!
Air: house : 12lbs Fire: 500mW 488nm Blue laser H20 cooled LARGE Water: 1 liter 1xPBS Jet in Air Nozzle (circle of fire) Air: self made: 70lbs Fire:3-7 low power lasers from UV to deep red/ Air cooled small/ Water: 10 Liter dual 0.22u filtered PBS Fixed Cuvette Nozzle 1977 vs. 2007
What hasn’t changed: • Laser stream intersection • Cell interrogation via hydrodynamic focusing • Droplet formation for sorting • Priority for cellular integrity
What has changed: • Standard Multi Laser Excitation • Polychromatic Analysis • High Throughput 4 way cell sorting • Instrument automation routines • Expansion of applications • Instrument sophistication
Workshop Objectives • Share hands on experiences for users and operators • Highlight major elements of FACSAria • Optimize instrument utilization • Verify Experimental Set-ups • Minimize instrument down time • Have fun and learn something
The Chi of Flow Cytometry • Organization • Standardization • Observation • Implementation • Instrument 氣
Turning a user into an operator ( and vice versa) • Fixed Cuvette • Ceramic Flow Cell • O – ring stabilization • Clog Control • Compensation selection • Compensation correction • Dynamic Sorting
Fixed Cuvette/nozzle tip • Keep windows clean • Know thy nozzle tip • Correct droplet strobe pattern • Backup tip with o-ring • Proper nozzle reseat techniques • Camera clean • Static neutralization • 70 vs. 100 micron tip
Compensation Selection • Why Compensate • Beads vs. cells • Auto compensation • >100% compensation • Compensation minimization • Exceptions to the rules
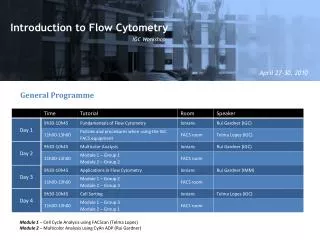
AGENDA • Introduction: Instrument Overview • 4 Way Sorting • SP Analysis on murine bone marrow • Ca++ flux on murine splenocytes • Case studies in FACS: analysis and sorting • Discussion
FACSAria StartupProcedures • Remove protective Cover • Lift up Flow cell access door • Turn on Aria and laser • Wait for Acquisition dashboard to connect to instrument • Run instrument start up (do long clean once a week for sterilization of lines and plenums) • Turn on stream: should look like day before • Lower flow cell access door • Turn on sweet spot • Warm up for 5-10 minutes • Check sheath fill if necessary • Change waste tank with back up tank
General Sort Set Up • Open Accudrop experiment ( preset experiment or new experiment template) • Run Accudrop note: FSC-A and FSC-H/SS-A and SS-H/and APC-Cy7 –A and APC-CY7-H: note position using title letter positions adjust area scaling if necessary • Adjust flow rate to 2000-2800/sec with setting no greater than 3 • Note location of beads with respect to preset regions adjust red laser time window to maximal signal. Go below and above, note starting time value • Set P1 region on FSC-A histogram to include entire scatter region, verify that sort mode is set to fine tune and press sort button and press cancel for waste drawer to open • Press optical window button and adjust sort timing so that at least 95% of beads fall in left sort box on stream camera display • Note drop 1 value and place in box on droplet stream area settings • Unload tube and run facs clean for 1-2 minutes to sterilze for next sort
FACSAria 4 Way Sorting • Verify 4 good side streams deflecting to each tube. If not : fine adjust tip to get satellite merger, clean plates, nozzle tip area, strobe area and nozzle tip with ddH20- dry with q-tip/kimwipe and q-tip static guard to remove residual saline, replace o-ring if leaky. (Drop pressure by 10 pounds in emergency and reset drop delay and timing windows if outer side streams can not deflect far enough out) • Run bead test sort if necessary • Run mouse spleen spike bead test sort if necessary • Actual Sort: Run freshly PRE-FILTERED sample to get adequate distribution profile Set up template, remove unnecessary parameters, run auto comp if necessary, adjust Area scaling , gate out doublets, set non-overlapping sort windows, use population hierarchy to confirm appropriate subpopulation derivation, put windows in sort box set mode to preset optimal sort settings(0 32 0) turn on test streams, verify stable and well separated, turn off test streams, adjust flow rate to 1, press sort and listen for waste drawer to open. Verify drawer open if not certain. Put in appropriate tubes (e.g. eppendorf, or 5ml culture tubes) • Once sorting begins verify side streams on camera , temperature set to desired value, sample agitation on, adjust droplet charging if necessary to get tightest center stream,monitor gap value for stability, increase flow rate gradually by 1-2 unit increments to desired flow rate, note flow rate versus coincidence rate, adjust to get maximal yield with minimal coincidence adjust window extension width lower to get less electronic aborts . Ideal rates for purity and sorting and reasonable coincidence 19-23K/sec • Note ratio of each 4 side streams , (70u tip with above sort precision sorts at a volume of 1 million per ml), remove most frequent population when tube is about 85% full , do while sort is going lift flow nozzle access door to stop streams temporarily. Replace tube as quickly as possible, lower door and resume sorting • Monitor drop stability, sample volume and side streams. Adjust sort gating regions if necessary. Listen for spark gap arcing within deflection plate area, as well as center stream drift outside waste catcher • Monitor flow rate, if drops down up rate to 11 and back down to 4-5 see if rate is restored, if not unload sample, PRINT SORT REPORT, revortex sample, look for clumps, filter if necessary and reload sample with flow rate of 1. Reactivate sort and increase flow rate gradually back to previous flow rate. • Run sample till no volume left, print sort report, rinse lines, and reanalyze sorted fractions if desired (recommended)
4 way Bead sort to check Instrument Accuracy Protocol • Beads needed • 1: Accudrop: cat#345249 • 2: Calbrite APC: cat #340487 • 3: Sphero Rainbow Fluorescent particles 3.0-3.4um(mid range FL1) cat# 556298 • 4: " " " " " ( brighter?) cat# 556291 • First : click on new experiment icon and used default pmt setting 250, 300, 500,etc..... • and made single graphs of all pmts log except FALS and two parameter of Hoechst blue vs. APC Cy7 • Second: Add a few drops of each bead to separate tube add 1xpbs(200ul) and run/ record 5,000-10,000events • Third: Adjust APC Cy7 down to 385 volts when run Accudrop to get beads on scale. Use Biexponential display option • Four: mix beads together one at a time and run and gate on where peak showed up on apccy7 vs. hoechst blue histogram (that way can see where each bead size scattered based on color gating) • Fifth :mixed all beads together and create four distinct sort regions on APC-CY7 vs. Hoechst Blue graph and did a four way sort for about 4 minutes sorted about 1.2 million. Use custom sort precision settings which is : 0 32 0 (VERY VERY IMPORTANT!) I did not have them very concentrated and sorted at 11 flow rate (bad for core stream) • reanalyze each fraction with a pbs wash between each tube.
Presort Frequency 4 way bead sort @ 20,000/sec (max) mixed with murine spleen 4 way bead sort Spiked with Fixed Murine Spleen cells
SP Analysis and Sorting • Create SP experiment template: Hoechst blue/Hoechst red/PI/FA/FSC/and SSC with appropriate single and two parameter histograms including all Area and H parameters. FSC and SSC width parameters also selected. If phenotyping is desired, select appropriate fluorescent parameters. Check that 450 and 670 filters are in Trigon and 635lp dichroic filter is in slot. ( Initially)Make sure signal processing is going to correct pmt, test by removing filter and noting signal response. • Run UV bead standard, verify median fluorescence intensity and CV value from previous bead standard run and preset region window values, check UV laser dealy time window verify optimal timing by going up and down from preset value by 2-4 units. Note starting time window value prior to changing. Adjust if necessary. • Recheck Sort delay with Accudrop and do a test sort with Accudrop and uv bead mix to verify UV channel is being delayed correctly ( usually not necessary). Make sure all systems are ice cold.( sample station and collection holder) • Run SP controls and sample . Adjust Scatter and Fluorescent PMT voltages so that scatters are on scale and controls are set to appropriate scale location. Use log Ho blue and red to see overall DNA cell cycle distributions, check UV timing window and see if increased signal can be observed by increasing window timing slightly, if not return to original setting. Gate on PI negative population and do a drill down to a HO blue (y Axis) vs. HO red (Y axis) profile . Switch HO BLUE to Linear and adjust voltage so that G0/G1 peak is at channel 100,000 note cell cycle profile Increase HO BLUE PMT voltage so that G0/G1 linear HO-Blue peak is centered up around channel 200,000 and G2/M peak is off scale. Adjust HO-Red sample so that it’s G0/G1 peak position is also around 200,000 or so. Let Stream stabilize at lower flow rate settings(1-2) for a minute or two to counter effects of initial sample boost., then record at least 100,000 PI negative gated events. Repeat with verapamil or reserpine control samples. Look for “SP tail or hook” below and slightly to left of G0/G1 cluster. Better to adjust concentration than to raise flow rate value. Aliquot sample in multiple small tubes • If population is identified set up sort gates for sp and non- SP areas and sort. Small eppendorf vial collection tubes pre-coated and filled 30-65% with appropriate media is recommended. Remember sorted concentration is approximately one million/ml so be sure to not overfill collection vessel. • Reanalysis of sorted population can be conducted if desired. Note however that sorted fractions may pump out Hoechst dye while being sorted and will also lose dye while being collected in a non Hoechst containing media collection vial. • Check with investigator about how cells were post sort and what results were obtained to aid in improving future sorts
UV Bead StandardFluoresbrite® BB Carboxylate Microspheres 4.5µmPolysciences LOG LINEAR Hoechst Blue PMT= 225 Volts
Calcium Flux on Murine Splenocytes • Check Filters on UV Trigon: Indo Violet=405nmBP, Indo Blue=530nmBP with 505LP dichroic • Run UV bead standard adjust timing if necessary • Set up Calcium flux experiment template. Use FSC vs. SSC/SSC vs., Time versus ratio (25%,50% and 75%),Indo Blue vs. Indo Violet (LOG vs. LOG), relevant Immunofluorescent Histograms and time vs. ratio of subpopulations if necessary • Check to see that sample station temperature is set to Off, 20C, or 37C depending on desired temerature. Check to see sample agitation is set to 300 rpm • Run controls( unstained, indo alone, single color, etc…) set up compensation, adjust ratio so that resting population 25% ratio is at 40,000 to50,000 value. Use worksheet histogram zoom in to zoom in on time versus ratio histogram • Actual Flux RUN: set stopping time to 30 seconds, set events to recort to 1million or 2.5 million, load indo1 loaded sample, after boost waitfor 5 seconds or so and press record, after record is done, unload sample, LIFT NOZZLE ACCESS DOOR, RESET TIME TO 270 SECONDS,ADD STIMULI,VORTEX BRIEFLY,LOAD SAMPLE ,, PRESS RECORD, PRESS APPEND, COUNT 5 SECONDS, LOWER NOZZLE ACCESS DOOR, and continue run. • Sit back and relax • Transfer files to post analysis program to calculate percent responding and relative increase in calcium concentration. Use FloJo ,or create regions using Diva software and statistics export in Excel spreadsheet
Ca+ flux with Indo 1-AM Useful to study heterogeneity within Defined subpopulations • -Ratio metric Dye: Normalizes for cell size variability • As well as laser power fluctuations over time • -Very sensitive to slight shifts within populations • Ultraviolet excited can be used with many visibly excited • fluorochromes
Calcium Flux • Method to get Gap in Time vs. ratio Histogram ( Lift Cover/reset time stop/append file/close cover after 5 seconds)
FACSAria: UV ApplicationsCalcium Flux Kinetic Assays Ionomycin
0 minutes 5 Ionomycin FACSAria “SORP” 20Mw 355nm UV Laser 10ug GAM IgG1 Calcium Flux on T cell subpopulations
Case Studies in FACSAnalysis and Sortingto be provided by participants • Actual samples • Virtual samples • Viable Cell Cycle with HO33342 on dual stained GFP/DsRed cells • Treg Various : compensation methods • Biexponential data displays
Multiple Gating strategies help identify low frequency functional subpopulations
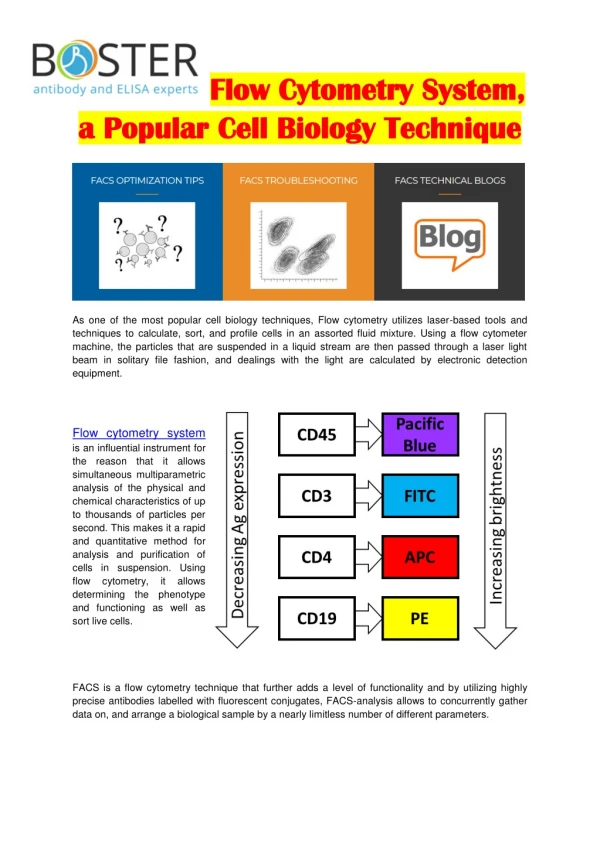
Four way reg sort Multicolor(5) Minor populations : Four way sorting: Treg Story CD45ra FITC CD127 PE CD25 PE-CY5 CD4 PE-CY7 CD3 PAC BLUE
POST SORT REANALYSIS: HUMAN PBL CD3+CD4+ CD45RA+ &CD45RA- Treg+/Teffector+/ -- 98.4 99.4 97.1 99.9
Discussion • Instrument Specific • Essentials • Clog Control • Flow Cytometry in General • Anything else THANK YOU!
Clog ControlLevel I • Lift Cover • Open door check for spray • Instrument clean-> Contrad 2 times • Turn on stream • Door open check for stream • Check for strobe droplet recovery • Check for red laser intercept spot • If none of above : go to Level II
Clog ControlLevel II • Clean table/ organize tools • Remove tip/ remove o-ring • Remove cam/ dry excess fluid • Visual check tip with 10x obj if poss. • Ultrasonicate 10 sec minimal ddH20 • Kim wipe/Vacuum air dry tip/ visual check orifice • Reseat o-ring with q-tip and ddH20 • Place back in nozzle/cam up/ check o-ring • Turn stream on/ verify Level I recovery steps • Hand adjust nozzle cam to restore droplet pattern
Clog ControlLevel III • Repeat Level I and II for 2-5 minutes • Replace o-ring • Repeat Level I and II • Remove plates • Remove nozzle/ run pure stream • Turn off stream/ clean all saline/H20 rinse/static guard spray/ turn on stream if ok / turn off stream/reseat plates/ turn on stream apply level I / look for arcing / turn on sweet spot/ check test streams/ look for stable strobe stream • Yell at user for not filtering sample • Re filter sample if visually looks particulate • Replace nozzle