Hands-On Data Analysis
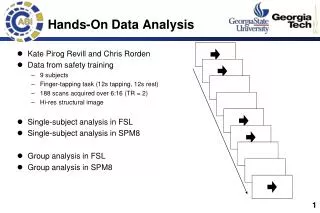
Hands-On Data Analysis . Kate Pirog Revill and Chris Rorden Data from safety training 9 subjects Finger-tapping task (12s tapping, 12s rest) 188 scans acquired over 6:16 (TR = 2) Hi-res structural image Single-subject analysis in FSL Single-subject analysis in SPM8 Group analysis in FSL

Hands-On Data Analysis
E N D
Presentation Transcript
Hands-On Data Analysis • Kate Pirog Revill and Chris Rorden • Data from safety training • 9 subjects • Finger-tapping task (12s tapping, 12s rest) • 188 scans acquired over 6:16 (TR = 2) • Hi-res structural image • Single-subject analysis in FSL • Single-subject analysis in SPM8 • Group analysis in FSL • Group analysis in SPM8
Finding the Data • Open terminal window • Navigate to directory home/public/coursedemo • Choose analysis technique (/spm or /fsl) • Choose subject (/subj1 through /subj9) • Data already converted from dicom format • Hi-res structural: T1mprages002a1001… • Functional: fmri12secon12secoff… • timing.txt (fsl folders only) Get it from the web http://www.cabiatl.com/Resources/FSL/subj9.zip
FSL: Single Subject • Launch FSL: fsl & • Data tab • First, must select functional dataset: Select 4D data
FSL: Single Subject • Click on folder to open file selection dialog • Select fmri12sec… file • Click ok in both boxes
FSL: Single Subject • Data tab: • Set TR = 2 • Set high-pass cutoff to 48 (2 x block size) • Delete 0 volumes • Total volumes and output directory set automatically
FSL: Single Subject • Pre-Stats tab • Set spatial smoothing to 8mm • Other settings ok
FSL: Single Subject • Stats Tab • Don’t add motion parameters • Choose full model setup
FSL: Single Subject • One explanatory variable: motor • Custom format • Choose timing.txt (3 column file with block onsets, durations, and strengths) • Uncheck temporal derivative (block design)
FSL: Single Subject • Contrasts tab • One contrast: areas more active during the motor task than during rest • Name it motor>rest • Click Done, model will appear: does it make sense? • (click on it to make it disappear)
FSL: Single Subject • Registration • Make sure Normal search, 12 DOF are selected • Could add hi-res structural here, but won’t to save time & preprocessing steps
FSL: Single Subject • Save as design.fsf • Click Go to start analysis • Web browser will open to track progress (takes ~ 10 minutes)
FSL: Single Subject • Done? Check it out… • Click on blue links to view results: • Pre-stats: motion parameters • Stats: model design • Post-stats: activation map and voxel fits • Registration: alignment of functional image to template
FSL: Group Analysis • All individual subject analyses must be completed first • Navigate to /home/public/coursedemo/fsl and create your own folder for group analysis (name it after yourself). Enter this folder and launch FSL (fsl &)
FSL: Group Analysis • Set tab at top left to Higher-level analysis • Data Tab: • Inputs are FEAT directories • 9 inputs • Output directory should be ok if you launched FSL from the directory I told you to create for yourself!
FSL: Group Analysis • Click on folders to get to file selection dialog and select the fmri...feat directory for each participant
FSL: Group Analysis • Stats Tab • Make sure to choose Mixed effects: Simple OLS • MUCH faster- doesn’t take subject variability into account • Choose Full model setup
FSL: Group Analysis • EVs Tab • Only 1 group of subjects • Want to see motor activity for all subjects, so set EV to 1 for each input
FSL: Group Analysis • Contrasts Tab • Only one contrast (where all subjects show activity) • Click Done to view design
FSL: Group Analysis • Post-Stats tab • Lower Z threshold to 1.64 (5%) • Feel free to repeat analysis later w/ different thresholds..
FSL: Group Analysis • Save as groupdesign.fsf • Click GO to start analysis (will launch web browser to monitor progress) • Takes about 5 minutes
Finding the Data Get it from the web http://www.cabiatl.com/Resources/SPM/subj9.zip • SPM pipeline • Preprocess: realign (motion correct), coregister (align T1 to fMRI), normalize (warp to standard space), smooth • Conduct statistics. • Data already converted from dicom using dcm2nii • File in /home/public/coursedemo/subj1...subj9 • Hi-res structural: T1mprage… • Functional: fmri12secon12secoff… 22
SPM: Single Subject Again, get into proper directory: cd /home/public/coursedemo/spm/subj9 Launch MATLAB matlab & At prompt, launch SPM8spm8 (“spm fmri” outside CABI) 23
SPM: Single Subject • Select Realign: Estimate & Reslice from spatial preprocessing bar • Realign: Estimate & Reslice • Click New:Session 24
SPM: Single Subject • Realign: Estimate & Reslice • Highlight Session and click on Select Files to open dialog box 25
SPM: Single Subject • Select all fmri12sec… images (hold down shift) • Hint: type ^f.* in filter box to only show files starting with f • 188 files selected • Click Done 26
SPM: Single Subject • Realign: Estimate & Reslice • Leave all options as defaults • Save as realign.mat • Press green arrow to run (2 min) • Close batch editor 27
SPM: Single Subject Progress shown in lower left window Results of each step generally displayed in Graphics window 28
SPM: Single Subject • Select Coregister: Estimate • Coregistration • Choose reference image: meanfmri12secon… • Choose source image: T1mprages… • Save as coreg.mat • Click green arrow to run (2 min) • Click around results to check alignment 29
SPM: Single Subject Segmentation: find grey and white matter in hi-res structural image (improves normalization) 30
SPM: Single Subject • Segment • Highlight Data and select file T1mprages… • Save as segment.mat • Run (~ 5 minutes) • To view results, click Display • “c1T1mpr” is gray matter, “c2T1mpr” is white matter 31
SPM: Single Subject Normalize: warp images to standard space (functionals and structural) Choose Normalize:Write 32
SPM: Single Subject • Normalize • Click on New:Subject • Choose parameter file: • T1mpr…_seg_sn.mat • Choose Images to Write: • all 188 rfmri… files 33
SPM: Single Subject • Normalize • Set Voxel Sizes to 3 3 3 • Save as func_norm.mat • Run (~ 1 min) • Also normalize structural image • Same procedure except • Images to Write = T1mprages • Voxel Sizes = 1 1 1 34
SPM: Single Subject To check results of normalization, choose Check Reg, then select wT1mprage… and one of the wrfmri… images and see if they match up well 35
SPM: Single Subject • Smoothing • Highlight Images to Smooth and select all 188 wrfmri… files • Check that FWHM = [8 8 8] • Save as smooth.mat • Run (~ 3 min) • No display 36
SPM: Single Subject • Click Specify 1st-level • 1st-level • Highlight Directory and select ./ (current directory) for saving SPM.mat file • Timing Parameters • Units: Seconds • Interscan interval: 2 • Data and Design: New Subject/Session • Highlight Scans and choose all 188 swrfmri… files 37
SPM: Single Subject • 1st-level • Conditions: New Condition • Name: motor • Onsets: can enter as a list of start times but can also use MATLAB notation 0:24:360 38
SPM: Single Subject • 1st-level • Durations: 12 (all blocks are 12s long, so only one value needed) • High Pass Filter: 48 • Save as design.mat • Run (1min) • You will see a design matrix when completed 39
SPM: Single Subject • Estimate • Choose SPM.mat file • Run (~ 2 minutes) 40
SPM: Single Subject • Results • Click on Results button in Inference bar • Lets define our statistical contrast… • Select SPM.mat • Choose Define new contrast… 41
SPM: Single Subject • Results • Define contrast: • Name: motor>rest • Type: t-contrast • Contrast: enter 1 and press Submit • Hit OK. • Then hit Done in previous window 42
SPM: Single Subject • Results • Mask with other contrasts: no • Title: motor>rest • P value adjustment: FWE • P value: 0.05 • Extent threshold: 0 • Will run for < 1 min… • View Results • Right-click on glass brain to find global maximum voxel 43
SPM: Single Subject Things to try Overlay activation on structural image: Overlays: sections Select wT1mprage.. file Select max voxel and plot timecourse: Plot: Plot… Fitted Responses Predicted Against scan or time 44
SPM: Group Analysis Navigate to /home/public/spm and make your own group directory (i.e. kategroup) Launch MATLAB and spm8. Choose Specify 2nd-Level 45
SPM: Group Analysis 2nd-Level Choose a results directory (the one you just made) Scans: navigate to each subject’s directory and choose con_0001.img Don’t hit OK until you’ve completed all 9 subjects Save as groupdesign.mat Run (~2 min) The resulting matrix is a white box (same effect for all subjects). 46
SPM: Group Analysis Estimate Choose SPM.mat from your group directory Run (~ 2 min) Results Choose SPM.mat from your group directory Define new contrast Name: group_m>r T-contrast Contrast: 1 Hit submit, OK, done 47
SPM: Group Analysis • Results • Mask with other contrasts: no • Title: motor>rest • P value adjustment: FWE • P value: 0.05 • Extent threshold: 0 • Will run for < 1 min… 48