Using SPSS for Quantitative Review and Descriptive Statistics
160 likes | 287 Vues
Using SPSS for Quantitative Review and Descriptive Statistics. ScWk 242 – Session 8 Slides. Quantitative Research Designs. What is a research design ? Types of quantitative research designs: Experimental group research design Quasi-experimental group research design

Using SPSS for Quantitative Review and Descriptive Statistics
E N D
Presentation Transcript
Using SPSS for Quantitative Review and Descriptive Statistics ScWk 242 – Session 8 Slides
Quantitative Research Designs • What is a research design? • Types of quantitative research designs: • Experimental group research design • Quasi-experimental group research design • Pre-experimental group research design • Cross-sectional correlational research design • Longitudinal research design • Single subject research design • These research designs used quantitative statistics to analyze study findings
Measurement in Quantitative Research • Concepts are abstract ideas • Variables are concepts that are specific and defined • Operationalizing a variable means that we are measuring it • Variables are measured in many ways including: • Questions on a survey • Information in a case file • Information in an administrative database
Review of Quantitative Terms • Independent variable • Dependent variable • Hypothesis • Extraneous variables
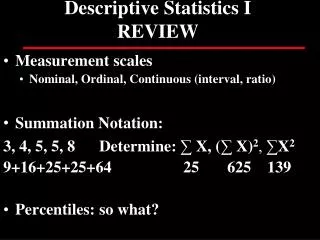
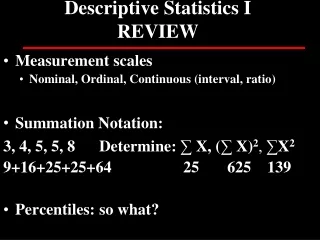
Types of Variables Categorical variables: Nominal: categories with no ranking (e.g. gender, race/ethnicity, place of birth, etc.) Ordinal: categories with a ranking (e.g. educational level, income categories, Likert scales (strongly agree, agree, disagree, strongly disagree) etc.) Continuous variables: A zero point and equal distance between values (e.g. age, height, weight, # of hours studying a day, etc.).
What kind of variable is it? • The number of visits to a homeless shelter ________ • How satisfied are you on a scale of 1 (Very satisfied) to 5 (Very dissatisfied)? _______ • Have you ever had training in Cognitive Behavioral Therapy? (Yes/No)? ____ • Student’s GPA _____
Categorical Variables • Frequencies and percentages are used with categorical variables • Frequency: a count • Percentage: a proportion of the total
What is the difference between Percent, Valid Percent and Cumulative Percent? Which one should you report?
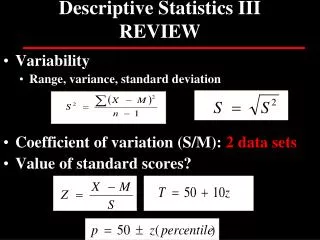
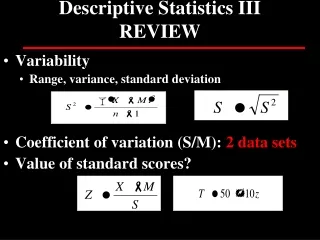
Continuous Variables • Means, medians, standard deviations, and ranges are used with continuous variables • Mean: average (add all values and divide by total number of values) • Median: when all of the values are put in order from lowest to highest, the median is the middle number *Use median instead of mean when there are outliers (extreme high or low values)
Continuous Variables (Continued) • Standard deviation: A number that reflects how much variation there is from the average value in the dataset. A large SD indicates a lot of values that are different from the mean. A small SD means there are not a lot of values that are different from the mean. • Range: The highest value in the dataset minus the smallest value in the dataset. Example: if the ages of students in our class ranged from a low of 23 years to a high of 57 years the range would be 23 (low) to 57 (high).
Descriptive Statistics Using spss Go to the following public website: • National Survey of Substance Abuse Treatment Services http://www.icpsr.umich.edu/icpsrweb/SAMHDA/studies/34539 From the website: • Principal Investigator(s): United States Department of Health and Human Services. Substance Abuse and Mental Health Services Administration. Center for Behavioral Health Statistics and Quality • Summary: The National Survey of Substance Abuse Treatment Services (N-SSATS) is designed to collect information from all facilities in the United States, both public and private, that provide substance abuse treatment.
Descriptive Statistics using spss From the website: • Methodology - Sample: The Inventory of Substance Abuse Treatment Services (I-SATS) provides the sampling frame for N-SSATS. Two categories of treatment facilities in I-SATS may be distinguished. The largest group of facilities includes those that are licensed, certified, or otherwise approved by the state substance abuse agency to provide substance abuse treatment. The second group represents the SAMHSA effort in recent years to make I-SATS as comprehensive as possible by including treatment facilities that state substance abuse agencies, for a variety of reasons, do not license or certify. Many of these facilities are private, for-profit, small group practices, or hospital-based programs.
Descriptive Statistics using spss • Mode of Data Collection: computer-assisted telephone interview (CATI), mail questionnaire, telephone interview, web-based survey • Response Rates: There were 17,376 facilities in the survey universe. Of these facilities, 12 percent were found to be ineligible for the survey because they had closed or did not provide substance abuse treatment or detoxification on March 31, 2011. Of the remaining 15,222 facilities, 14,302 facilities (94 percent) completed the survey and 13,720 (90 percent) were eligible for this report. The percentage of respondents who completed the survey via the mail was 8.4 percent, while 12.3 percent completed the survey via telephone, and 79.3 percent completed the survey using a Web-based questionnaire.
Descriptive Statistics using spss • Generate frequencies and percentages for the variables in this question: • 1. Which of the following substance abuse services are offered by this facility at this location, that is, the location listed on the front cover? MARK “YES” OR “NO” FOR EACH YES NO • 1. Intake, assessment, or referral .......... 1 0 • 2. Detoxification ...................................... . 1 0 • 3. Substance abuse treatment (services that focus on initiating and maintaining an individual’s recovery from substance abuse and on averting relapse) ................................................ 1 0 • 4. Any other substance abuse services ................................................ 1 0 The variable names in the dataset are: OTHNONTX DETOX TREATMT ADMIN
Descriptive Statistics - SPSS Open SPSS dataset • Notice that you can choose “variable view” (shows all of the variables in the dataset) or “data view” (shows all of the data in the dataset) • Go to variable view • Find the variables: • OTHNONTX • DETOX • TREATMT • ADMIN Review the variable labels and values for these four variables (notice # of “missing” categories)